

 LinkMeshObservability Data Collection Management
Collector Fleet Management
Running one collector is easy. Running a fleet is a discipline.
 Philippe Braxmeier← Back to blog
Running a single OpenTelemetry Collector is a solved problem: write a config.yaml,
start the process, point it at a backend. Running fifty across production, staging,
and three regions is a different job entirely. Each collector is a process on a host
with its own config, its own version, and its own quiet way of drifting out of line —
and by default you have no central place to see any of it, let alone change it.
Collector fleet management is the discipline of operating many OpenTelemetry Collectors as one system: enrolling them, seeing their state, pushing configuration, rolling changes out safely, and keeping the whole fleet current. This guide walks through what that actually involves, and links out to deeper pieces on each part.
What “fleet management” actually means
At small scale, you manage collectors the same way you manage any process: SSH in, edit the file, restart. That approach has a ceiling, and you hit it fast. Once a handful of collectors becomes a fleet, five problems show up at once:
- Config drift. A hotfix applied on one host at 3am never makes it back into the template. Six months later no two collectors are quite the same, and nobody knows which config is authoritative. (More on catching this early: detecting collector config drift.)
- Version skew. Collectors get installed at whatever version was current that week. Some carry unpatched CVEs; some lack a receiver a newer pipeline needs. Keeping them aligned by hand does not scale — how to keep a fleet up to date.
- No visibility. You cannot answer “is every collector healthy, and what is each one running?” without logging into each host.
- Blind changes. Editing a pipeline in place, with no preview and no diff, is how a too-greedy filter reaches production and quietly drops the data you needed.
- SSH-driven ops. Every change is manual, per-host, and unaudited — the opposite of how you run the rest of your infrastructure.
Fleet management replaces all five with one control plane: a single place that sees every collector, holds the authoritative configuration, and applies changes consistently.
The control plane: OpAMP and remotecfg
The mechanism underneath fleet management is a management protocol. The collector opens one outbound connection to a control plane; the control plane pushes configuration down and receives status back up. Two open protocols do this today:
- OpAMP (Open Agent Management Protocol) — the OpenTelemetry standard for
remote-managing agents. Status up, config down, package updates. Upstream
otelcol-contribspeaks it via the OpAMP supervisor. We wrote a full explainer: OpAMP explained. - remotecfg — Grafana Alloy’s native remote-configuration protocol, polling-based rather than push. If your fleet is Alloy, this is the path. See Grafana Alloy vs the OpenTelemetry Collector for how the two collectors compare.
Both are open and standards-defined, and both leave the data plane untouched — telemetry still flows straight from the collector to your backends. The management connection carries configuration and health, not your logs and traces. A good fleet manager supports whichever collector you already run rather than forcing a fork or a proprietary agent.
Configuration as the source of truth
Once a control plane holds every collector’s configuration, that configuration should live somewhere you can review, diff, and roll back — not in a database you have to trust blindly. The strongest pattern is GitOps: every pipeline, route, and processor change lands as a commit with an author, a timestamp, and a diff.
That gives you three things fleet operations otherwise lack: an audit trail of who changed what, the ability to roll back to any prior state, and code review for telemetry changes the same way you review application code. We cover the pattern in GitOps for collector configuration, and the safety mechanics — staged rollout, health-gating, and reverting a bad change — in collector config rollout and rollback.
The related discipline is not shipping blind. Before a filter or transform reaches the fleet, you want to see a real record go in one side of the processor and come out the other — preview the pipeline before you ship it.
What you do with the fleet, once you can manage it
Central management is not the goal in itself — it is what makes the useful work possible:
- Refine at the source. Drop health-check noise, sample, and aggregate on the collector, before telemetry ever reaches a billed backend — reduce observability costs and sampling governance at scale.
- Protect sensitive data. Mask credit cards, emails, and custom fields on the host, before egress — masking PII in logs before they leave your network.
- Route by team and tenant. Send the right data to the right backend from one pipeline definition — the basis of a multi-tenant collector architecture.
- Enforce policy. Apply standards across the whole fleet instead of hoping each team gets it right — OpenTelemetry governance and enforcement.
Know when a collector stops carrying data
Managing a fleet centrally also means you can be told when part of it goes quiet. A collector that crashes is obvious. The harder failure is the one that stays up, keeps reporting healthy, and simply stops receiving anything — a log source that rotated away, a firewall rule that changed, an application that stopped emitting. Nothing errors. The data just isn’t there.
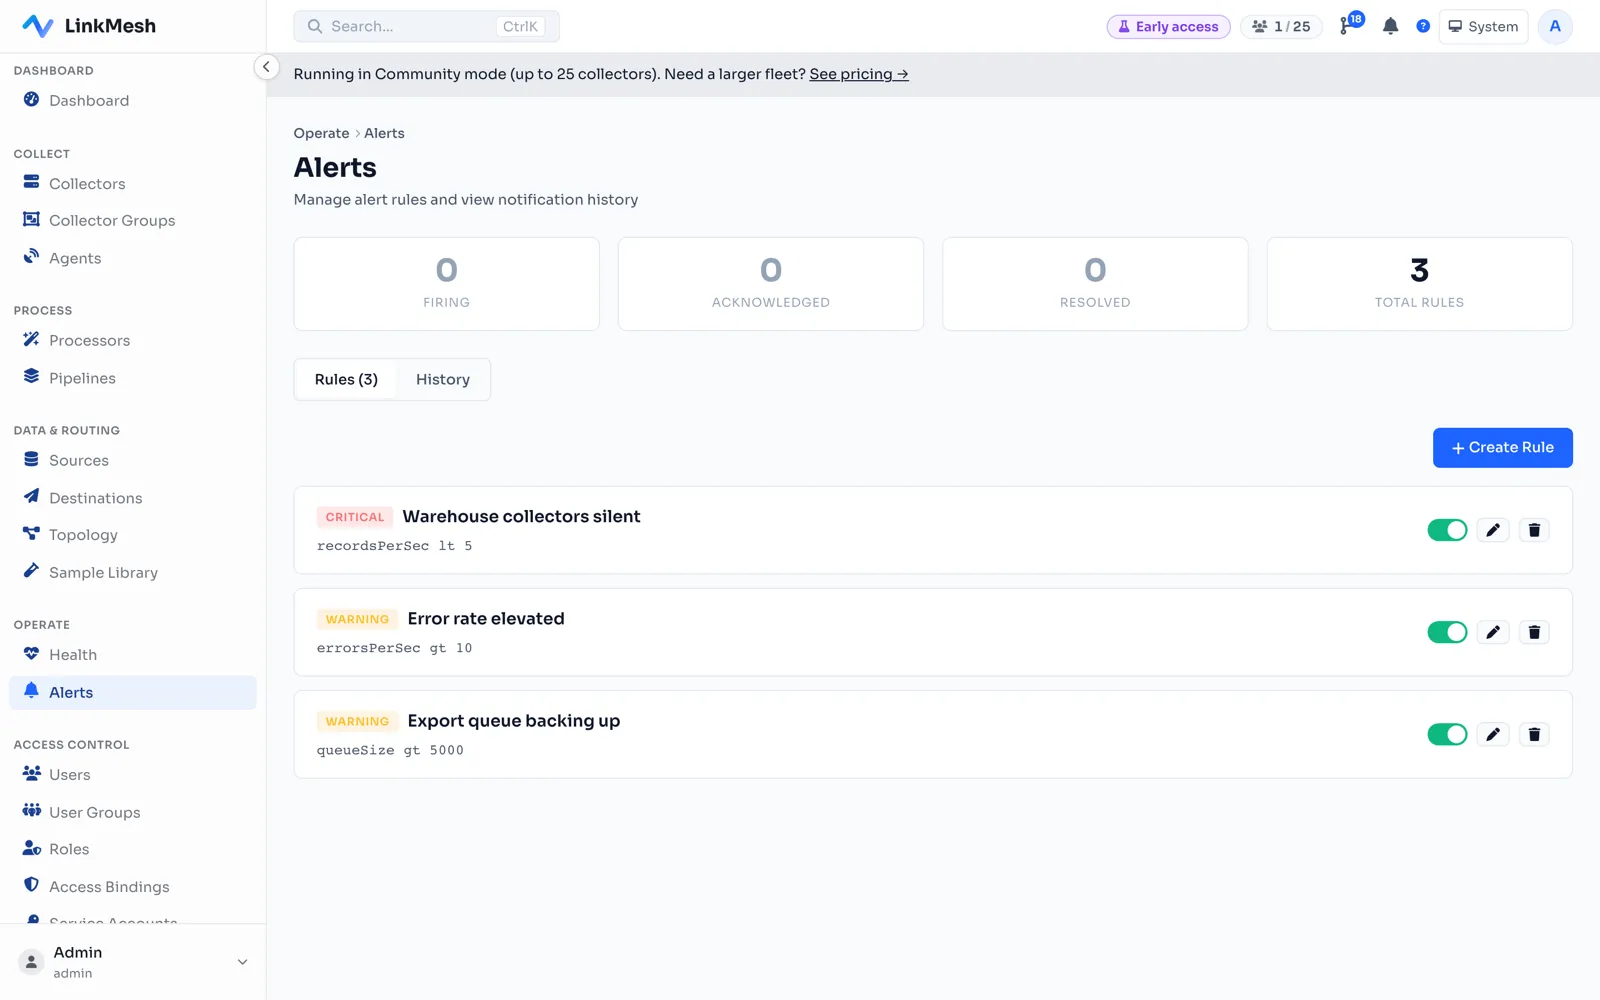
That is a threshold on throughput, not a health check: rules watch the rate of records moving through each collector and fire when it crosses a line you set.
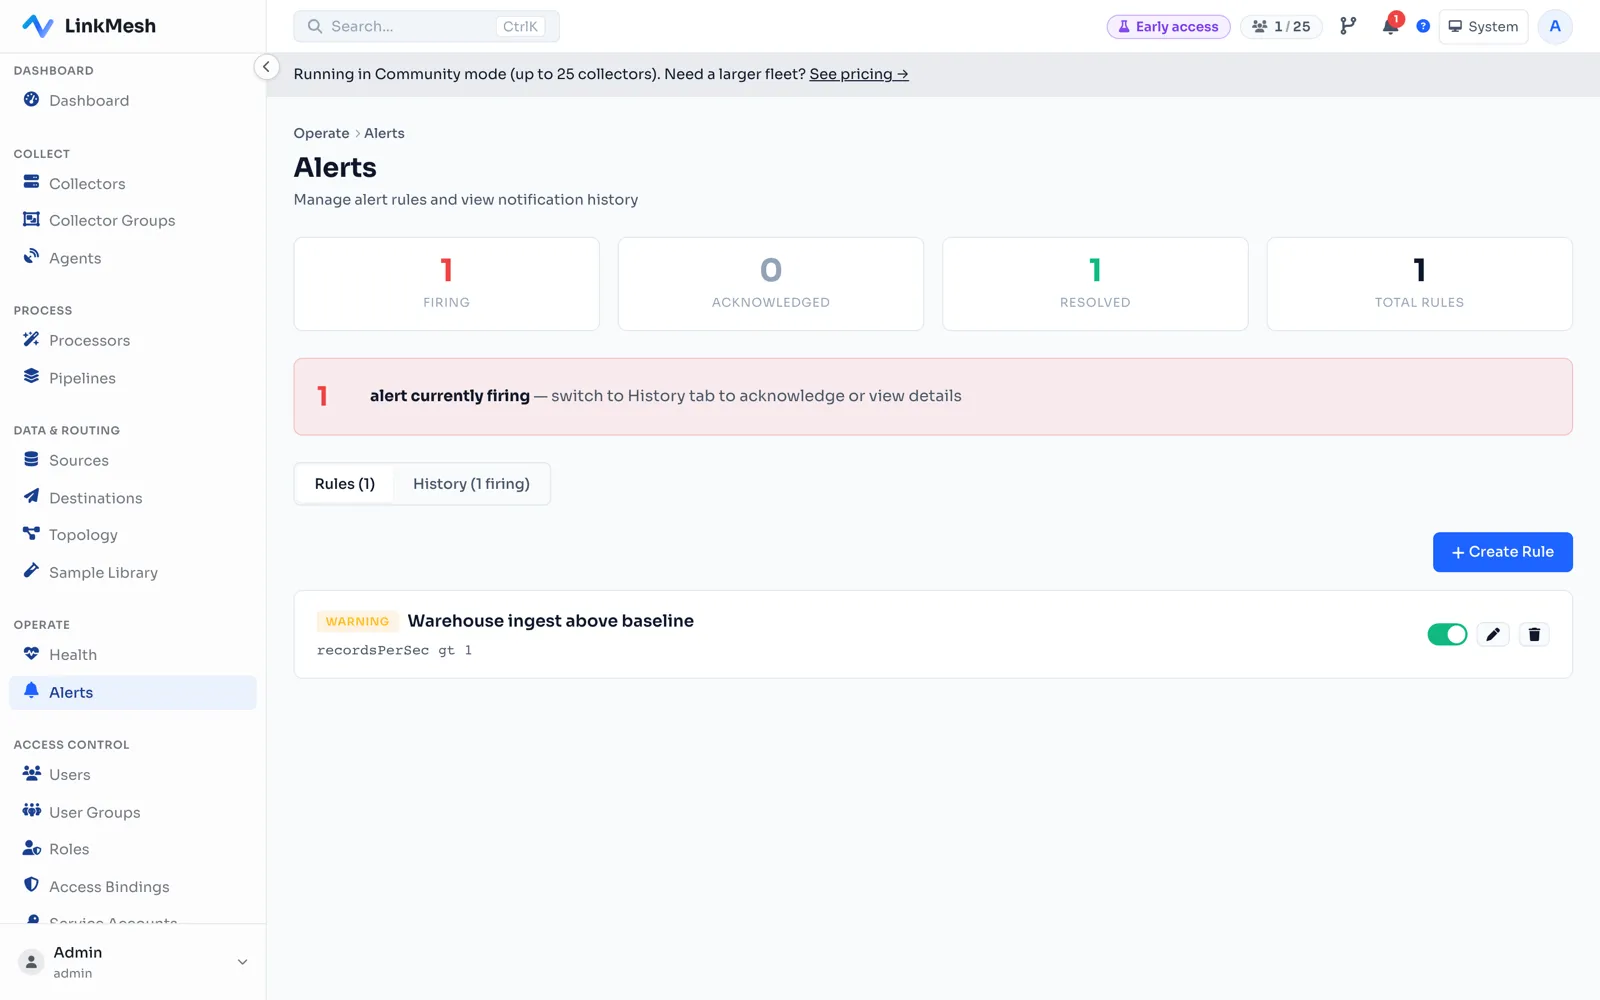
Because the rate is measured from the collector’s own metrics rather than inferred from a backend, the same mechanism covers both directions — too much data arriving, and none arriving at all.
Scaling the fleet
As the fleet grows, two more concerns become first-class. The control plane itself should not be a single point of failure, and neither should the collectors carrying your telemetry — see OpenTelemetry Collector high availability. And once multiple teams share the platform, isolation and per-tenant routing stop being optional; the multi-tenant architecture guide covers how to keep tenants separate without running a separate fleet for each.
Build or buy
OpAMP is an open protocol, so you can build your own control plane with libraries
like opamp-go. For a team with the engineering capacity and unusual requirements,
that is a legitimate path. The catch is everything around the protocol: a config
store, a fleet UI, authentication, pipeline editing, masking, routing, an audit
trail, throughput metering — and the ongoing maintenance of all of it. That distance
between the raw protocol and a working product is precisely the
control-plane gap OpAMP deliberately leaves open — and it
is what a fleet manager exists to fill.
Where LinkMesh fits
LinkMesh is a fleet manager built around exactly this workflow. Collectors enroll
over a single connection — otelcol-contrib via OpAMP or Grafana Alloy via
remotecfg, no fork — and the fleet UI shows status, version, throughput, and config
state for every node. Configuration is GitOps-audited; pipelines are previewed before
they ship; PII is masked at the source; and routing sends the right data to the right
backend. It runs on your own infrastructure, and it is priced per managed collector
rather than by data volume.
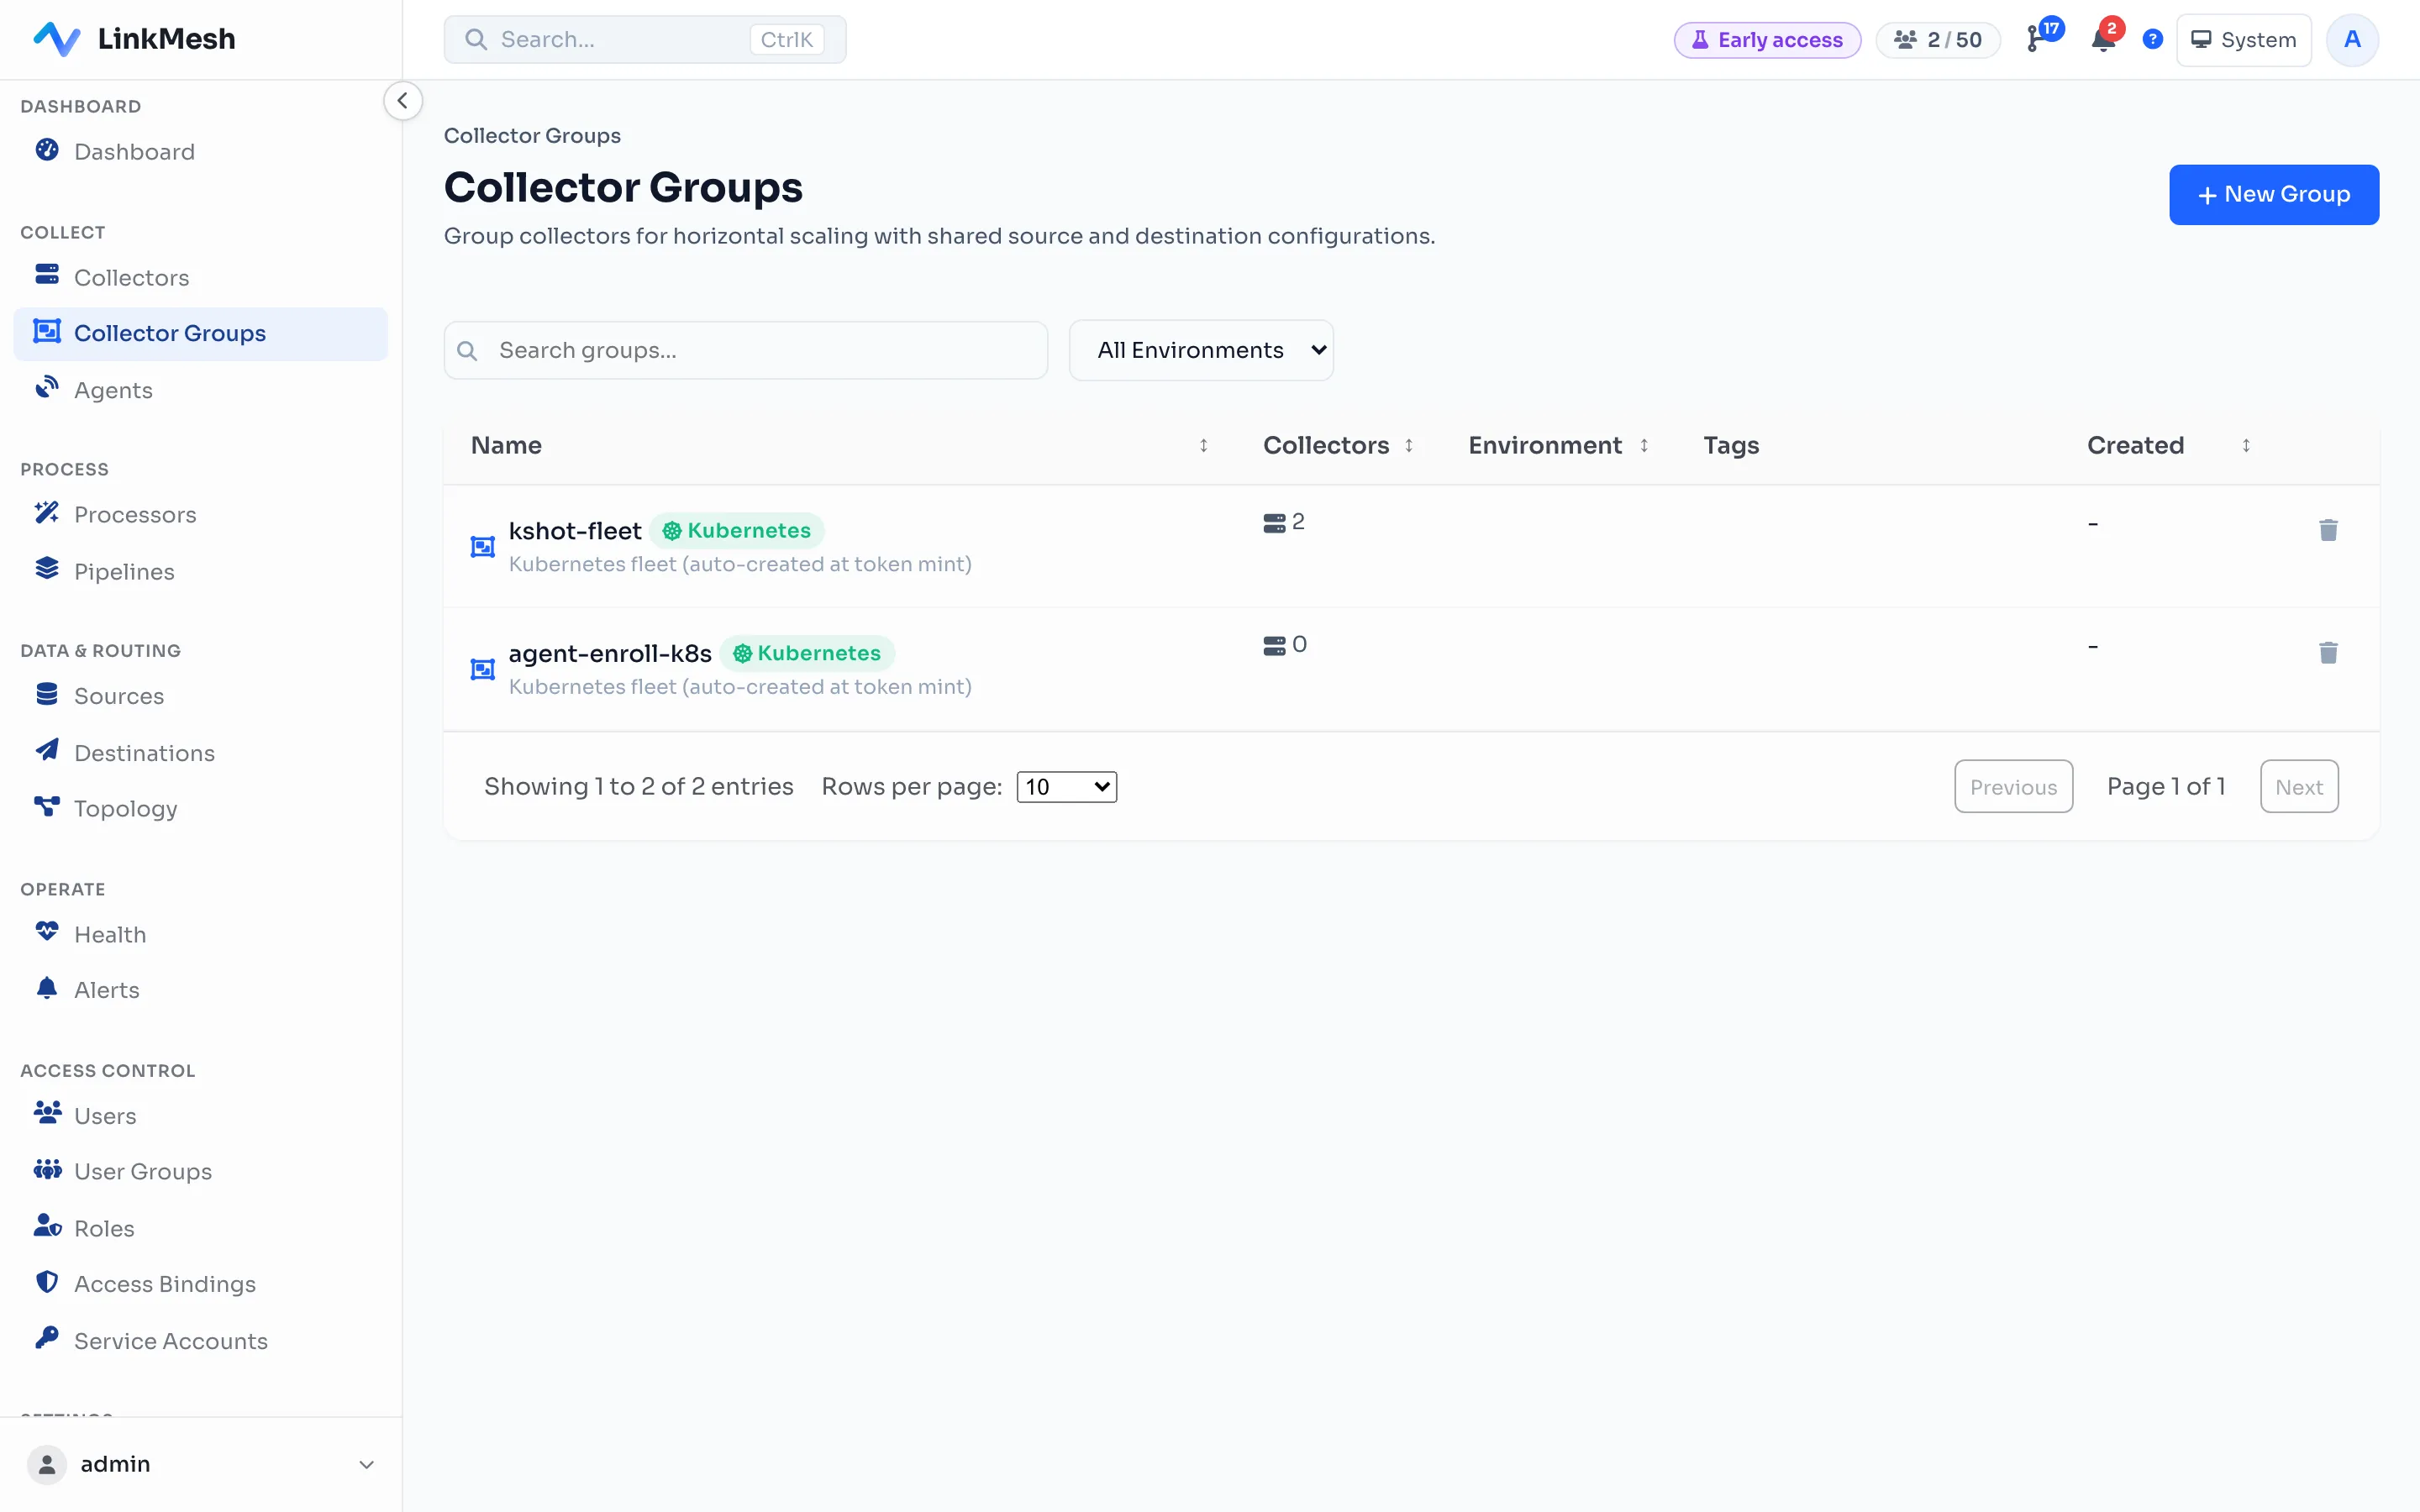
Collectors organise into typed groups — a Kubernetes cluster fleet is tagged distinctly from a VM host group, and each carries its own shared config — so even a large estate stays legible at a glance:
See what LinkMesh does, the details on on-prem and data handling, and per-collector pricing — the first 25 collectors are free after a no-card registration in the OpenSight Customer Portal (5 without one). When you’re ready, install it and enroll your first collector in about ten minutes.