
 LinkMeshObservability Data Collection Management
Preview the Chain, Not the Incident
Watch a real record move through every processor step before you save.
 Philippe Braxmeier← Back to blog
Editing a telemetry pipeline is one of those tasks where the feedback loop is brutally long. You write a filter to drop health-check noise, save it, push it to a collector, wait for it to apply, then go looking in your backend to see whether the right records survived. Get the regex slightly too greedy and you find out hours later — by noticing the logs you needed are gone.
The problem isn’t the pipeline. It’s that you’re editing it blind. You’re writing a transformation and hoping it does what you think, with no way to see the result until it’s already running on live traffic.
Borrowing a good idea from n8n
If you’ve used n8n, the workflow-automation tool, you know its best feature isn’t the node catalogue — it’s that you can open any node and see the actual data flowing through it: what came in, what the node did, what came out. You build with your eyes on real values, not an abstract diagram.
LinkMesh brings that same idea to OpenTelemetry pipelines. Open any step in a processor chain and you get a node detail view: the record on the way in, the step’s configuration, and the record on the way out — all in one frame.
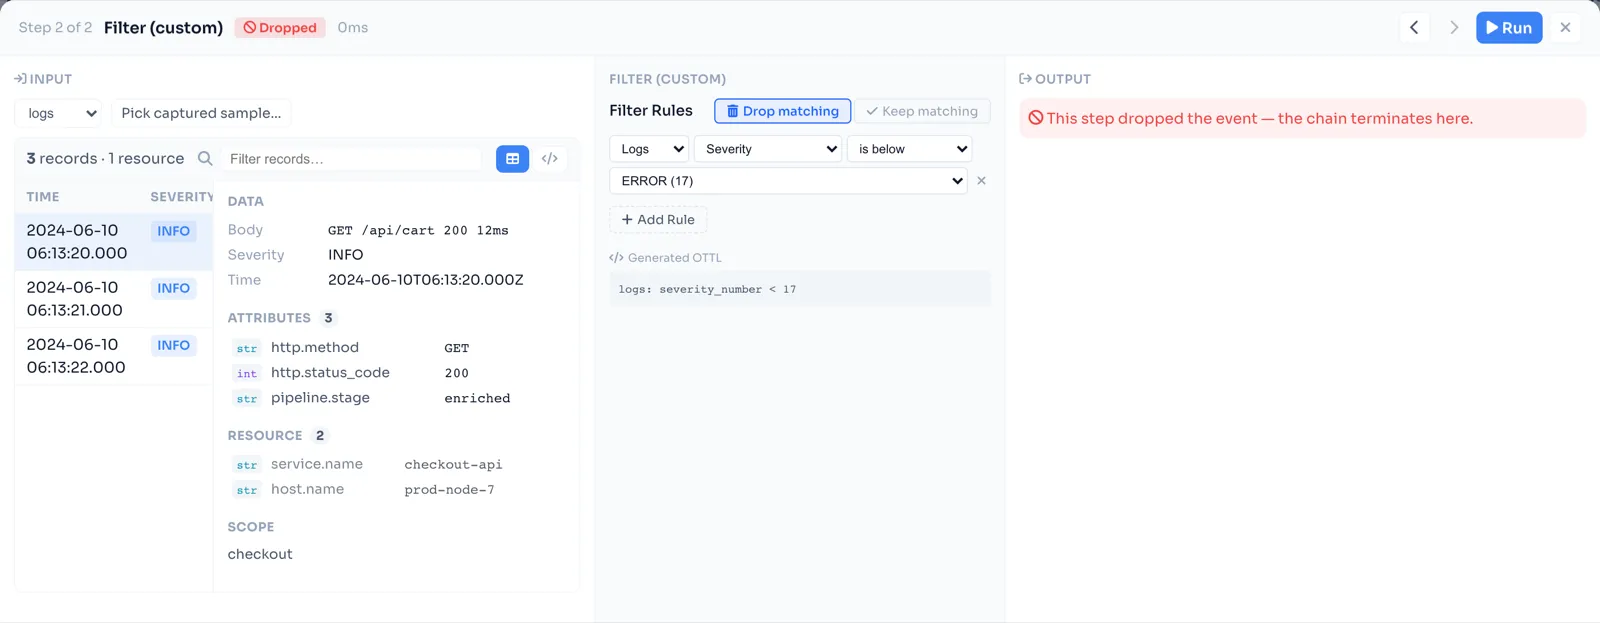
Read it left to right:
- Input — the records entering this step. Not a toy payload: real events,
with their body, severity, attributes (
http.method,http.status_code,pipeline.stage) and resource (service.name,host.name) laid out so you can see exactly what the step is working with. - Config — the step itself. Here a custom filter set to drop matching
where severity is below
ERROR, with the generated OTTL (severity_number < 17) shown right below the rule builder. You see the human-friendly rule and the actual collector expression it compiles to, together. - Output — the result. This record is
INFO, so it matched the drop rule, and the output pane says so plainly: this step dropped the event — the chain terminates here. No guessing why a record didn’t make it through.
That third pane is the whole point. A dropped record isn’t a mystery you reconstruct from missing data in your backend — it’s a labelled outcome you can see at the exact step that made the decision.
Step through the whole chain
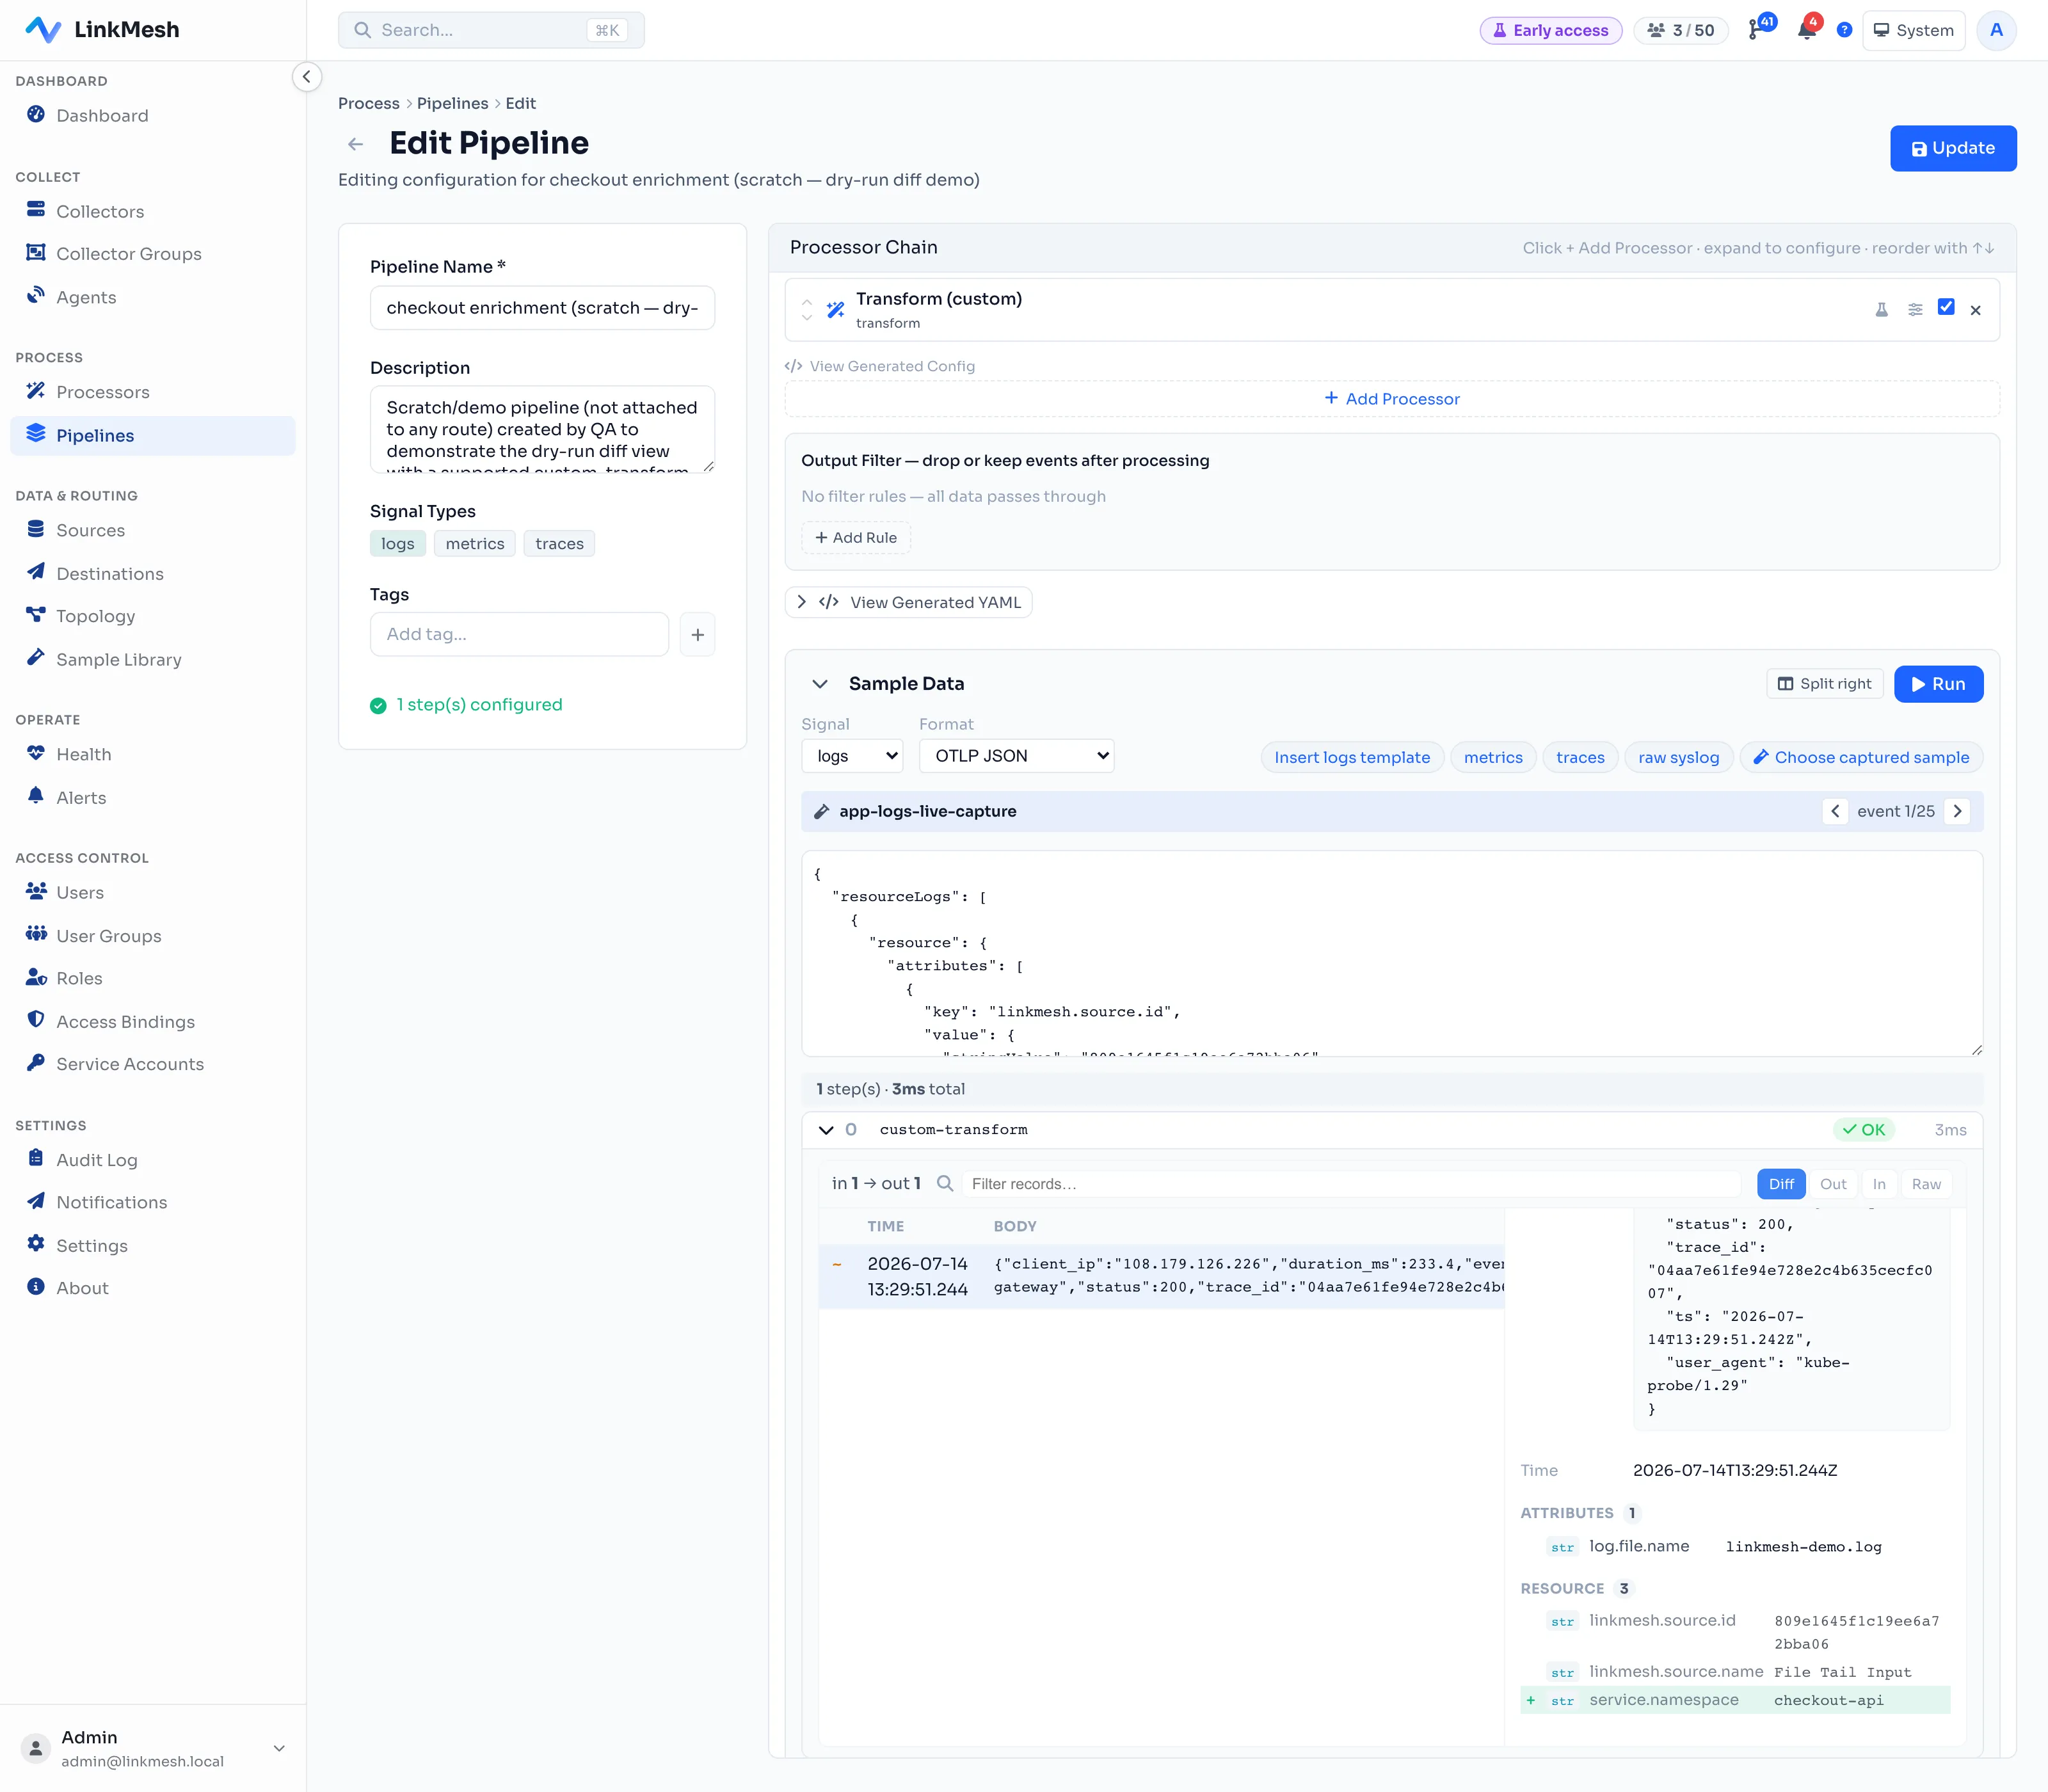
A chain is more than one step, and bugs love the seams between them — the step that rewrites a field the next step was matching on, the reorder that changes what survives. The preview lets you walk the chain one step at a time: move to the previous or next processor and watch the same record transform at each stage, with each step’s timing and status (passed, or dropped) called out.
When the final output isn’t what you expected, you don’t diff the whole chain’s input against its output and squint. You step through until you find the exact processor where the record diverged from what you wanted — and you fix that one.
The diff is semantic, not textual: it highlights the exact attributes a step adds, changes, or drops. So an enrichment that quietly sets the wrong value — or adds nothing at all — is obvious at a glance, not buried in a wall of JSON.
Test against real records, not a guess
A preview is only as honest as the data you feed it. You can paste a sample by hand, but the sharper workflow is to test against records your collectors actually saw.
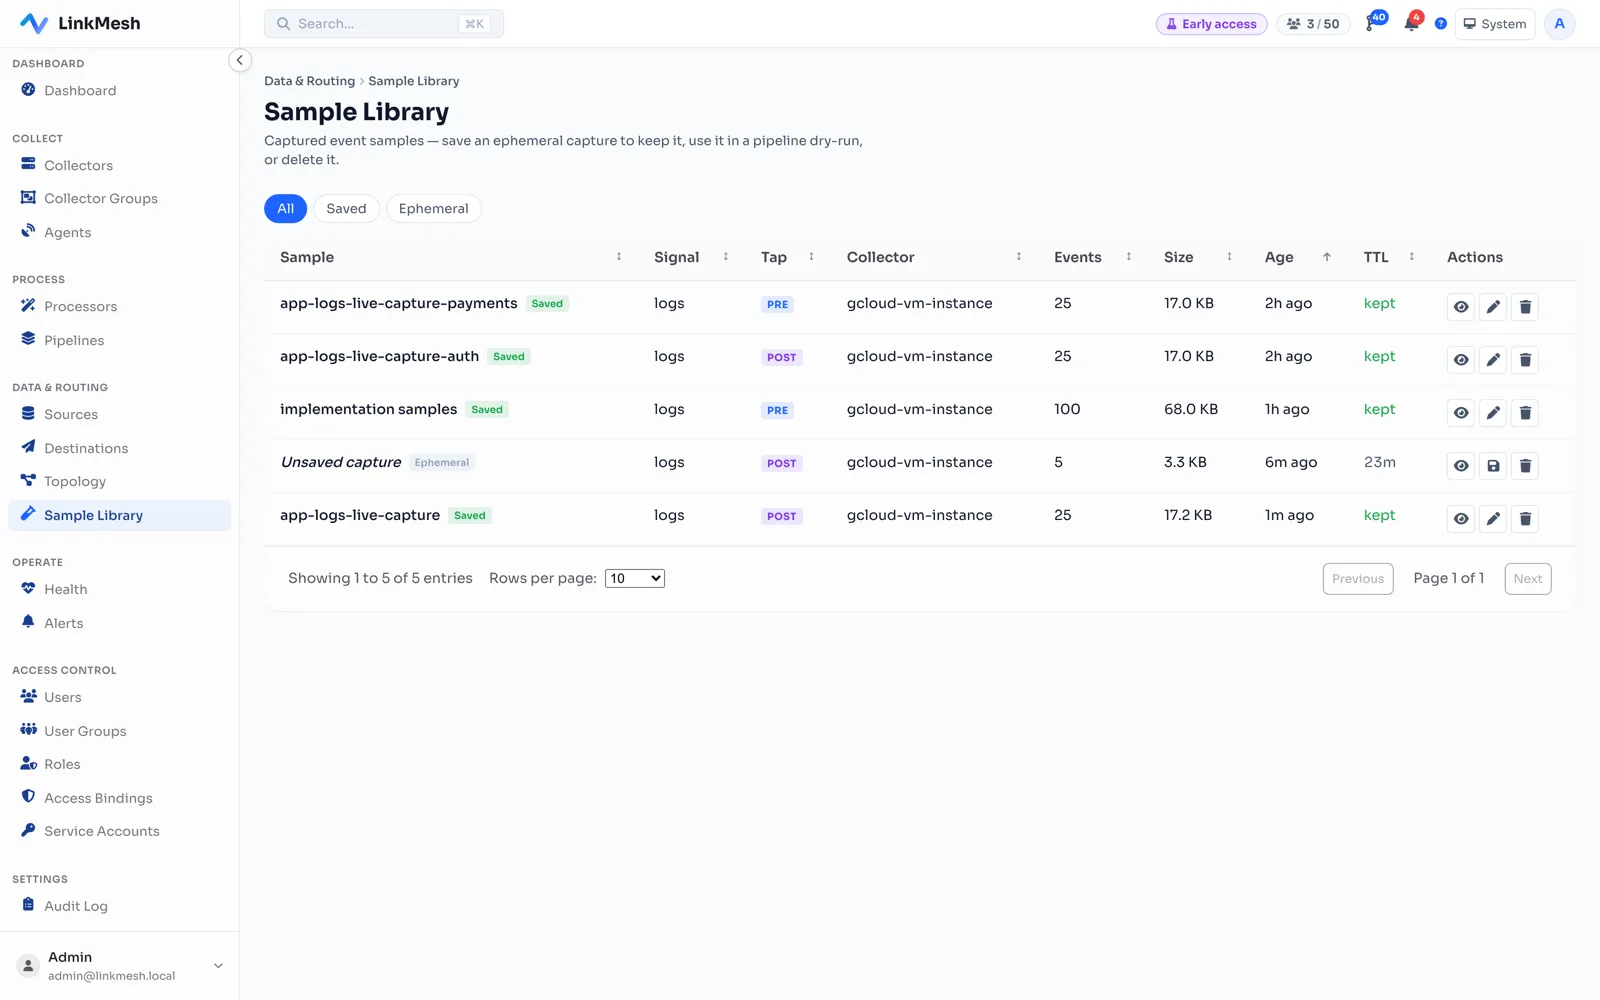
Capture a handful of events on a live route, save them to the Sample Library, and replay them into the preview. Now you’re validating your filter against the messy, real-world shapes your services actually emit — the log line with the unexpected null, the trace with the attribute you forgot existed — not a clean example that was always going to pass.
Edit with confidence
None of this changes what a pipeline can do. What it changes is how it feels to build one. Instead of write-save-push-wait-hope, you get write-see: every change validated against a real record the moment you make it, the regression caught at edit time instead of in an incident channel.
That’s the difference between shipping a pipeline you think is right and one you’ve watched be right.
Keep reading:
- The operator how-to, step by step: Preview a processor chain
- What Is a Telemetry Pipeline?
- Debugging Telemetry Pipelines with Live Capture