

 LinkMeshObservability Data Collection Management
One Agent to Rule Them All
Retire the forwarder, the OneAgent and the Beats. Keep one Collector.
 Roman Hüsler← Back to blog
Log into a production host in a mature estate and count the monitoring processes. A Splunk
universal forwarder tailing /var/log. A Datadog Agent scraping the same files plus
/proc. A Dynatrace OneAgent injected into the JVM. Maybe a node exporter, because
somebody wanted Prometheus. Four agents, four config mechanisms, four upgrade cycles, four
sets of outbound credentials — reading substantially the same data off the same disk.
Nobody designed that. It accumulated, one procurement decision at a time, and every layer of it is defensible on its own. The reason to look at it now is that OpenTelemetry finally makes the collection layer something you can own independently of the backends: one agent on the host, several destinations behind it. This post is about the agent side of that move specifically — how to consolidate monitoring agents onto a single OpenTelemetry Collector, in what order, and what genuinely does not survive the consolidation.
Platform, SRE and observability teams who own an agent estate — several vendor agents per host, several renewal dates, and pressure on cost or on the change-management overhead of patching all of them. Prerequisites: you can deploy a collector (systemd, container or DaemonSet) to your hosts, and you know roughly which agent feeds which backend.
What “one agent to rule them all” actually means
The phrase oversells itself in one specific way, and being precise about it up front is what keeps the project from stalling in month three.
A single OpenTelemetry Collector replaces the collection and forwarding function of every vendor agent you run: reading files, scraping host metrics, receiving syslog, tailing Windows event logs, accepting OTLP from instrumented applications, and shipping all of it onward. That function is genuinely commodity, and running four implementations of it is pure duplication.
What one Collector does not replace is the proprietary depth some of those agents carry — Dynatrace’s byte-code injection and PurePath, Datadog’s Live Processes view, Elastic’s ingest-pipeline library. Those are products, not collection. The honest framing is therefore not “one agent replaces four” but “one agent replaces four collectors, and you decide deliberately what to do about the two or three capabilities that were bundled with them”. What OpenTelemetry can and cannot replace is the longer version of that line.
Why four agents per host is the default
Agent sprawl is a consequence of how collection got sold, not of anyone’s carelessness:
- Each agent was welded to one backend. A universal forwarder feeds Splunk. A Datadog Agent feeds Datadog. Choosing a backend meant accepting its agent, so every backend decision became a fleet-wide deployment.
- Nobody owns the host as a whole. The SOC owns the forwarder, the app team owns the APM agent, the platform team owns the exporter. Each is a reasonable local decision and no one is accountable for the sum.
- Removing an agent is riskier than adding one. Adding an agent breaks nothing visible. Removing one might silently end a detection rule someone depends on, so the safe move is always to leave it running.
- Renewals are staggered. By the time one contract comes up, the other three are mid-term, so “consolidate everything” never lines up with a budget cycle.
The costs are equally concrete: you pay two or three vendors to ingest the same log line, platforms that bill per monitored host can count one machine twice, the resource footprint multiplies on machines sized for the workload rather than for monitoring, and each agent has its own idea of what the host is called — so correlating across backends means reconciling three naming schemes. The multiple-backends post covers the fan-out side of this; here the target is the process count itself.
The consolidation map
Almost all of it is a component-for-component substitution. Every mainstream vendor agent’s inputs have an OpenTelemetry counterpart:
| Vendor agent | OpenTelemetry replacement | Keep the backend? |
|---|---|---|
| Splunk universal forwarder | filelog, windowseventlog, journald receivers |
Yes — splunk_hec exporter |
| Splunk heavy forwarder (routing) | routing connector + multiple exporters |
Yes |
| Datadog Agent (infra checks) | hostmetrics + prometheus receivers |
Yes — datadog exporter |
Datadog trace agent / dd-trace |
otlp receiver + OTel SDKs |
Yes |
| Dynatrace OneAgent (host + logs) | hostmetrics + filelog receivers |
Yes — OTLP ingest endpoint |
| Elastic Agent / Beats | filelog, hostmetrics, windowseventlog receivers |
Yes — elasticsearch exporter |
| Azure Monitor Agent (DCR-based) | filelog + windowseventlog, exported onward |
Yes — via a Sentinel path |
| Prometheus node exporter | hostmetrics receiver (or scrape it) |
Yes — prometheusremotewrite |
| Fluentd / Fluent Bit | filelog receiver + OTTL processors |
Yes |
| Vendor ingest-side parsing | transform / filter / attributes processors (OTTL) |
Partly — some stays index-side |
The column that matters most is the third one. Consolidating agents does not require changing a single backend. Every one of those destinations has a supported exporter or an OTLP endpoint, so the first phase of this work is invisible to every dashboard, alert and saved search you have. That is what makes it approvable: no user-facing change, and the per-vendor detail lives in the dedicated playbooks — Splunk, Datadog, Dynatrace and Elastic.
What one collector looks like on the host
The four agents collapse into one process with one config. Receivers on the left, the shared work in the middle, the old destinations on the right:
receivers:
  filelog:
    include: [/var/log/*.log, /var/log/app/*.json]
    start_at: end
  journald:
  hostmetrics:
    collection_interval: 30s
    scrapers: { cpu: , memory: , disk: , filesystem: , network: , load: }
  otlp:
    protocols:
      grpc:
        endpoint: 127.0.0.1:4317

processors:
  resourcedetection:
    detectors: [env, system]
  transform/redact:
    log_statements:
      - context: log
        statements:
          - replace_pattern(body, "\\b\\d{13,16}\\b", "[REDACTED]")
  batch:

exporters:
  splunk_hec:
    endpoint: "https://hec.internal:8088/services/collector"
    index: "main"
  otlphttp/apm:
    endpoint: "https://apm.internal:4318"
  prometheusremotewrite:
    endpoint: "https://prom.internal/api/v1/write"

service:
  pipelines:
    logs:
      receivers: [filelog, journald]
      processors: [resourcedetection, transform/redact, batch]
      exporters: [splunk_hec]
    metrics:
      receivers: [hostmetrics]
      processors: [resourcedetection, batch]
      exporters: [prometheusremotewrite]
    traces:
      receivers: [otlp]
      processors: [resourcedetection, batch]
      exporters: [otlphttp/apm]
Two properties of that file are the point of the whole exercise. The host is read once, so you stop paying several vendors to ingest the same bytes. And the redaction rule sits in one place, which means it cannot be correctly applied on the path to one backend and forgotten on the path to another — the failure mode that makes per-agent masking rules untrustworthy. PII masking in logs covers that properly.
What you actually lose
Any consolidation post that skips this section is selling something. Four things do not come across, and each needs a decision rather than a shrug:
- Deep auto-injection. OTel auto-instrumentation is good and getting better, but it is not as invisible as the OneAgent’s byte-code injection, and some runtimes need more setup. Test the languages that matter on a real service before committing a date.
- Vendor-specific analytics and views. Davis root-cause, Live Processes, Smartscape, RUM and synthetics are backend products. If you keep the backend, you keep them — but they may expect that vendor’s own agent, so check what degrades when the agent goes.
- Curated content. Vendor agents ship integration catalogues and prebuilt parsers, dashboards and detections. OTel gives you receivers and OTTL; the content is work you take on. Onboarding messy logs is the realistic picture of that effort.
- The agent’s own control plane. This is the one that bites, and it gets its own section below.
There is also a category worth naming that is not a loss at all: the vendor’s support statement. Splunk, Elastic, Dynatrace, Datadog and Grafana all ship or support OTel Collector paths now. Consolidating onto OTel is a supported direction with every one of them, not an unsupported workaround.
One agent still needs one control plane
Here is the trap in “one agent to rule them all”: the agents you are retiring came with central management. Fleet for Elastic. Deployment Groups for Splunk. Dynatrace pushes OneAgent config and upgrades itself. Replace four managed agents with one unmanaged one and you have improved the process count while making manageability worse — now it is hand-synced YAML across every node, and nothing tells you when a host drifts.
Don’t accept that trade; it is not inherent. Agent management is OpAMP, an open protocol, and it is the piece that makes the consolidated agent an upgrade rather than a lateral move: central config, versions, and the ability to see which nodes actually applied what.
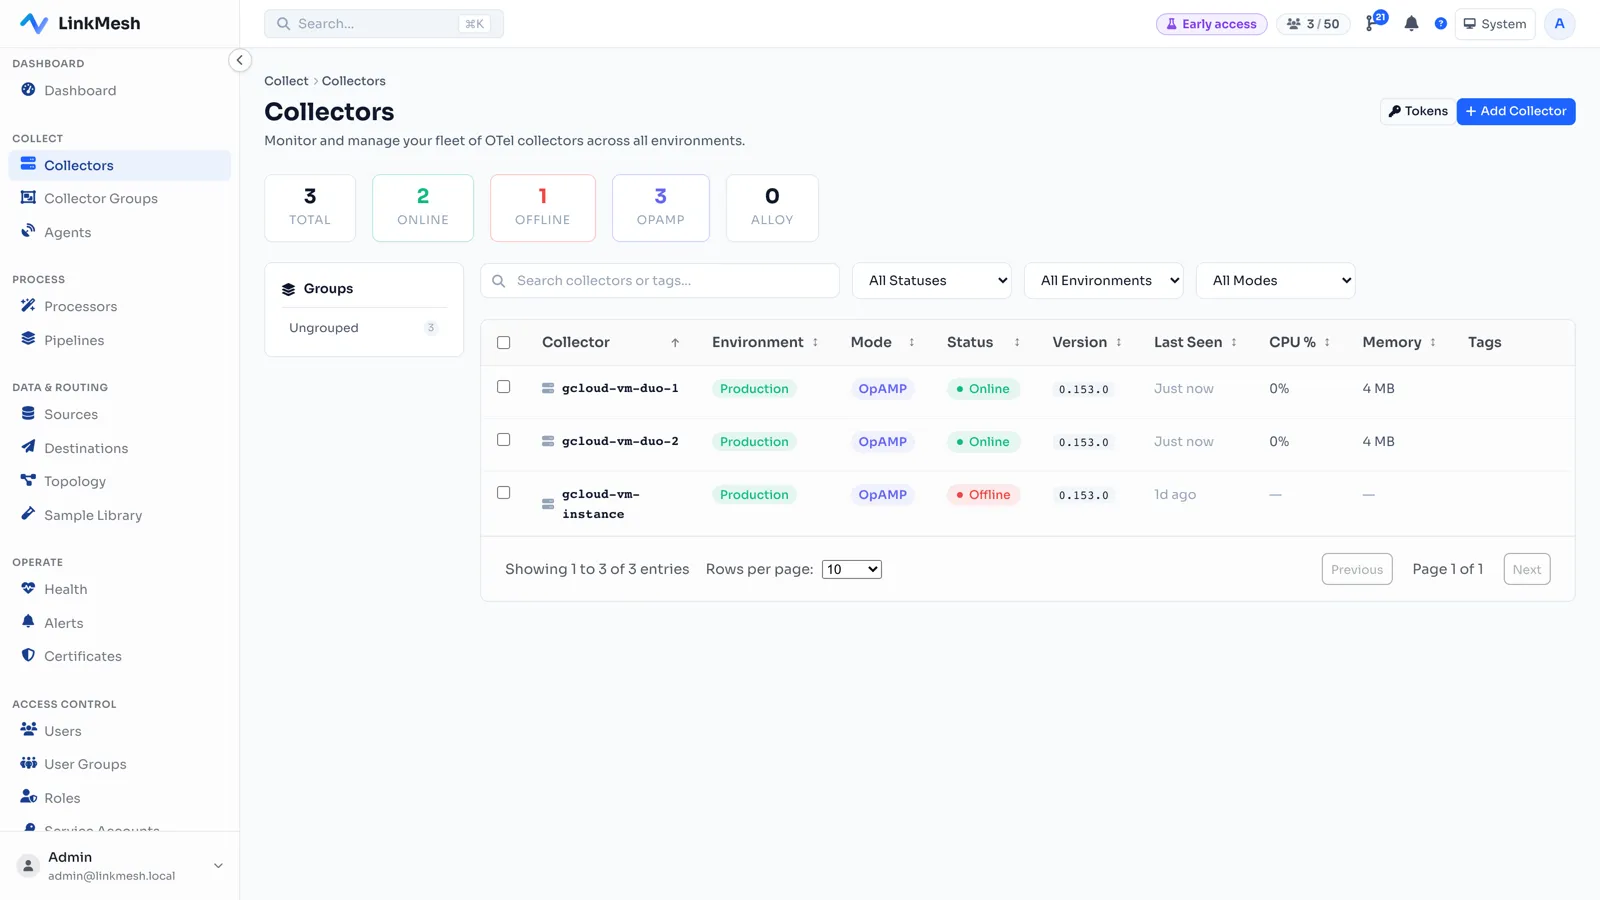
LinkMesh is a self-hosted OpAMP control plane for exactly this: point each collector at it with a token, compose sources, processors and routes in a visual UI, and it renders, validates and pushes the config to the right nodes — with per-edge throughput, so you can prove the duplicate collection is gone rather than assuming it. Because it is priced per collector rather than per GB, the tool managing the consolidation isn’t itself metered by the volume you are trying to cut. Config changes are versioned and reviewable (GitOps for collector config), and drift against the intended config is detectable (detecting config drift).
Consolidate in the order that de-risks it
The sequence matters more than the tooling. Each step is reversible and none of them is a flag day:
- Count the agents on one representative host, with CPU, memory and outbound volume per agent. This inventory is usually the slide that gets the project funded.
- Deploy the collector alongside everything, collecting nothing yet or only a single low-stakes source. You are proving deployment, enrollment and upgrade paths, not telemetry.
- Move one source, from the least contentious agent — typically the platform team’s own exporter or a non-security log path — and export it to that source’s existing backend. Nothing downstream changes.
- Verify parity, then remove the old agent’s claim on that source. Not the agent: the source. Two processes tailing one file is how a host gets double-counted and every line lands twice — see dual-shipping without duplicates.
- Repeat source by source until an agent has nothing left to do, then retire that agent. Agents come off the host as a consequence of moving sources, never as a step of their own.
- Only then start cutting volume. Filtering, sampling and dropping at the edge is the big financial win (reducing observability costs), but doing it while parity is still in question makes a gap impossible to diagnose.
- Keep the APM agent longest. Deep tracing is the hardest capability to match; do infrastructure and logs first and let the APM decision be its own project.
Before you retire the first agent
- Volume parity per source between the old agent and the collector over the same window — a large gap is a missed input or an over-eager filter, not an efficiency.
- Every input has a receiver, including Windows event channels, systemd journals and any custom vendor module someone added years ago.
- Field parity on timestamp, severity and the two or three extracted fields your alerts and saved searches actually key on. OTTL parsing differs from grok and from vendor pipelines, and this is the most common regression.
- Resource attributes —
service.name, host and environment — present and consistent, so one host is one host across all backends (enforcing semantic conventions). - Host budget checked: one collector doing four agents’ work needs the memory limiter and queue sizing set deliberately, not left at defaults (collector sizing).
- Failure behaviour tested: restart the collector and kill a destination. It must buffer and resume without losing data or wedging (collector high availability).
- The old agent stays installed but idle for an agreed observation window — one or two full business cycles — so rollback is a config push, not a redeployment.
One agent to rule them all is a real outcome, and unusually for this industry it does not require anyone to give up their backend, their dashboards or their renewal. It requires moving collection out from under the vendors one source at a time, and keeping the fleet managed while you do it.
LinkMesh replaces the vendor agent consoles with one self-hosted OpAMP control plane for your OpenTelemetry fleet — build and validate collector config in a UI, preview a change before it ships, push it to the right nodes, and watch per-edge throughput to prove the duplicate collection is really gone. Priced per collector, not per GB. See what it does, or stand one up in a few minutes.