
 LinkMeshObservability Data Collection Management
Alloy vs. OpenTelemetry Collector
Config, remote management, and running a mixed fleet.
 Philippe Braxmeier← Back to blog
“Grafana Alloy or the OpenTelemetry Collector?” is one of the most common questions when a team standardizes its telemetry agent. The honest answer is that they’re much closer than the versus framing suggests — Alloy is an OpenTelemetry Collector distribution — so the decision comes down to a few specific differences, not a winner-takes-all.
This post walks through what they actually share, where they genuinely differ (config language, remote management, ecosystem), a decision matrix, and how to run a fleet that has both without losing central control.
Lineage: Grafana Agent → Alloy
Grafana Alloy is the successor to the Grafana Agent. More importantly for this comparison, Grafana positions and builds Alloy as a vendor-neutral distribution of the OpenTelemetry Collector: it embeds OTel Collector components and adds Grafana’s own pipelines — Prometheus scraping and service discovery, Loki for logs, Pyroscope for profiles — plus native clustering and a built-in debugging UI.
So this isn’t “Grafana’s thing vs the open standard.” Both speak OTLP; both are built from OpenTelemetry Collector components. otelcol-contrib is the community “contrib” distribution — the broadest catalog of OTel receivers, processors, and exporters. Alloy is a curated OTel distribution with the Grafana/Prometheus ecosystem bolted on. Keep that framing and the rest of the decision gets much simpler.
Config language: River (Alloy syntax) vs YAML
The most visible difference is how you write a pipeline. The Collector uses YAML with
receivers, processors, exporters, and service.pipelines. Alloy uses a
component-based configuration syntax (originally “River”) where components are wired
by referencing each other’s inputs and outputs.
The same OTLP-in, batch, OTLP-out pipeline in the Collector (YAML):
receivers:
  otlp:
    protocols:
      grpc:
processors:
  batch:
exporters:
  otlp:
    endpoint: otlp.example.com:4317
service:
  pipelines:
    metrics:
      receivers: [otlp]
      processors: [batch]
      exporters: [otlp]
…and in Alloy:
otelcol.receiver.otlp "default" {
  grpc { }
  output {
    metrics = [otelcol.processor.batch.default.input]
  }
}

otelcol.processor.batch "default" {
  output {
    metrics = [otelcol.exporter.otlp.default.input]
  }
}

otelcol.exporter.otlp "default" {
  client {
    endpoint = "otlp.example.com:4317"
  }
}
Same pipeline, two mental models. YAML is a declared graph — you list stages and name
them in service.pipelines. Alloy is an explicit wiring graph — each component
declares where its output goes by reference. Alloy’s model is powerful when you’re
fanning discovery, scraping, and OTel components together in one agent; YAML is
simpler and more portable across the OTel ecosystem.
There’s also a learning-curve angle. YAML is familiar and copy-pasteable from the
huge body of Collector examples online. Alloy’s syntax takes a moment longer to
internalize, but the explicit references make large configs easier to reason about —
you can see exactly what feeds what, instead of matching names across a
service.pipelines block. Neither is hard; they just reward slightly different
habits.
Remote management: remotecfg vs OpAMP
Neither tool wants you hand-editing config on every host, and each has a native way to pull config from a central server:
- Alloy has a
remotecfgblock: the agent fetches its configuration from a remote endpoint (Grafana Cloud Fleet Management, or any compatible server) and polls for updates. - otelcol-contrib uses OpAMP — in practice via the
opampsupervisor, which applies pushed config and reports health. (We covered this in depth in OpAMP Explained.)
Both get you central config; they’re just different protocols. There’s a semantic difference worth noting: OpAMP is a push-and-report model over a persistent connection, while remotecfg is a pull-and-poll model. In both cases the agent authenticates to the server (typically a bearer token), and in both cases you want the config validated before it ships — a pipeline that fails to start is a bad pipeline no matter how it arrived. The practical consequence: if you run both runtimes, you’re managing two different remote-config mechanisms — unless your control plane speaks both (more on that below).
Ecosystem, UI, and self-telemetry
A few differences that matter day to day:
- Component catalog. otelcol-contrib carries the widest set of OTel components, including niche receivers and exporters. Alloy curates which OTel components it wraps, and adds the Prometheus/Loki/Grafana components the Collector doesn’t have. If you depend on a specific contrib component, check Alloy supports it; if you live in the Prometheus/Grafana world, Alloy has batteries the Collector doesn’t.
- Built-in UI. Alloy ships a web UI that visualizes the component graph and offers live debugging of what’s flowing through each component — genuinely useful when a pipeline misbehaves. The Collector exposes internal metrics and zPages but no built-in graph UI.
- Clustering. Alloy has native clustering to share scrape targets across instances; the Collector leaves that to how you deploy it.
- Self-telemetry. Both emit metrics about themselves — throughput, queue sizes, dropped data, exporter failures — so you can monitor the agent, not just what flows through it. Alloy surfaces much of this in its UI; with the Collector you scrape its internal metrics endpoint. Either way, watching the agent’s own health is what turns “data stopped arriving” from a mystery into an alert.
Neither of these makes one “better” — they push toward different homes.
Decision matrix: when Alloy, when otelcol, when both
| If you… | Lean |
|---|---|
| Live in the Grafana/Prometheus stack (scraping, discovery, Loki) | Alloy |
| Want the built-in component-graph UI + live debugging | Alloy |
| Need native clustering for scrape targets | Alloy |
| Want the broadest OTel component catalog / a niche contrib component | otelcol-contrib |
| Want a pure, vendor-neutral OTel posture + OpAMP | otelcol-contrib |
| Have a heterogeneous estate (some Grafana-heavy, some pure-OTel hosts) | Both |
That last row is the real world more often than people expect. Different teams, acquisitions, and platforms land you with Alloy on some hosts and otelcol on others — and that’s fine, as long as you can manage them together.
Running a mixed fleet from one control plane
The catch with “run both” is that Alloy speaks remotecfg and otelcol speaks OpAMP,
so naively you end up with two management planes. The fix is a control plane that
speaks both — you compose the pipeline once, and it delivers to each runtime the way
that runtime expects.
Without that, a mixed fleet means two dashboards, two config formats to author by hand, and two places to check whether a change actually landed — and the drift you were trying to eliminate creeps back in through the seams. A single control plane collapses that back to one inventory and one edit-and-apply flow, whatever each host happens to run.
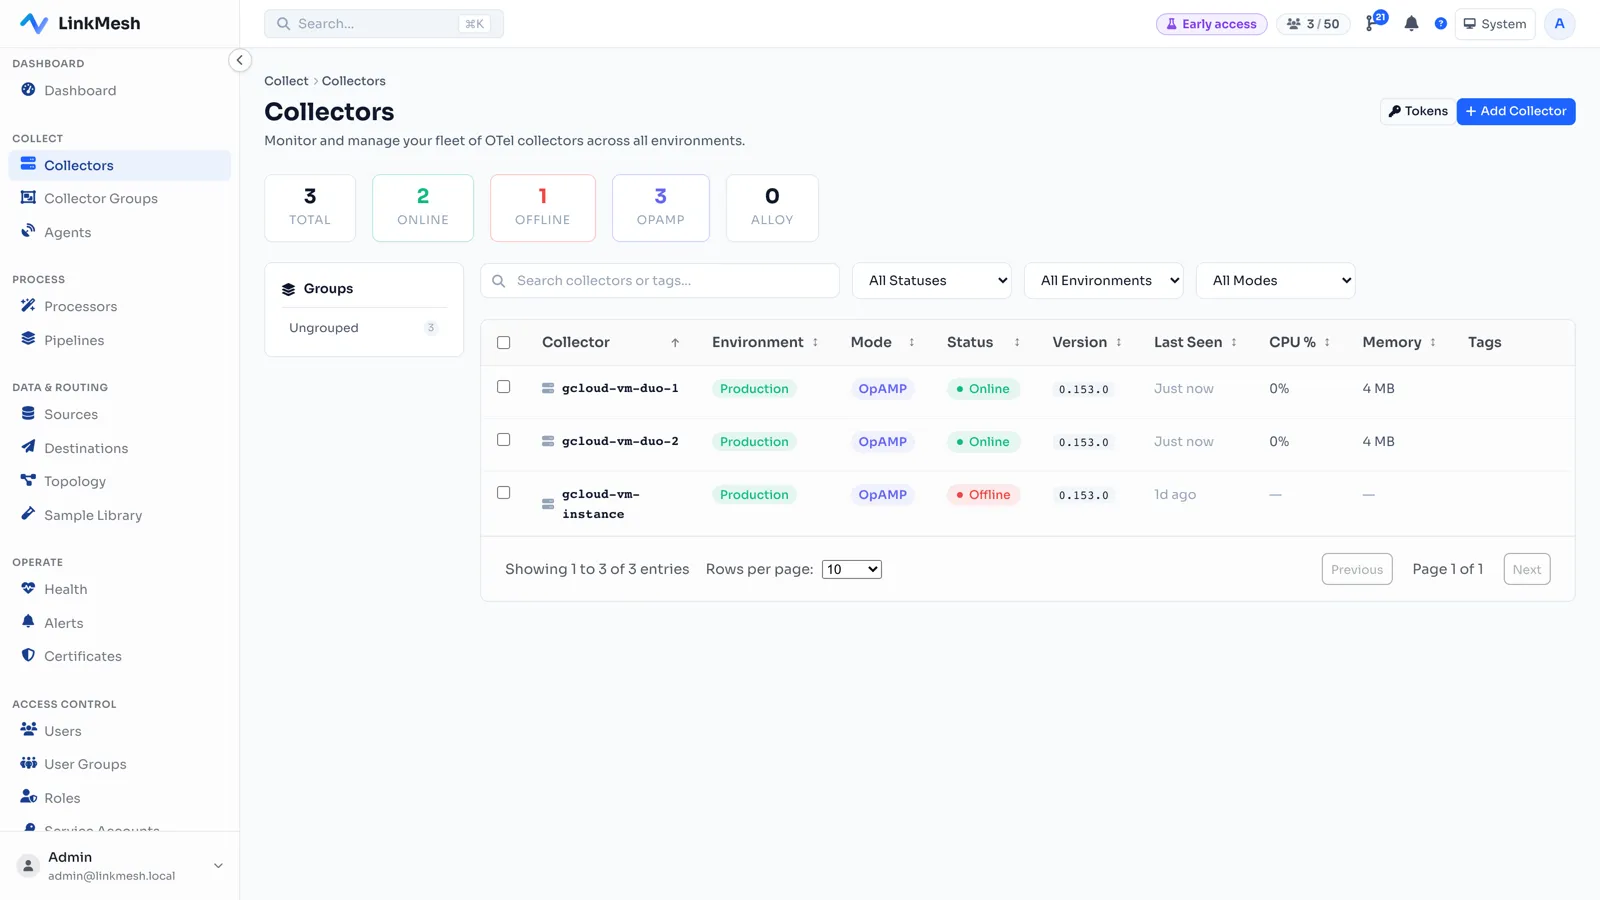
That’s how LinkMesh treats the runtime as an axis, not a fork. You
enroll Alloy over remotecfg and otelcol over OpAMP, and both show up in one fleet
inventory — same status, same config-apply history, same drift view:
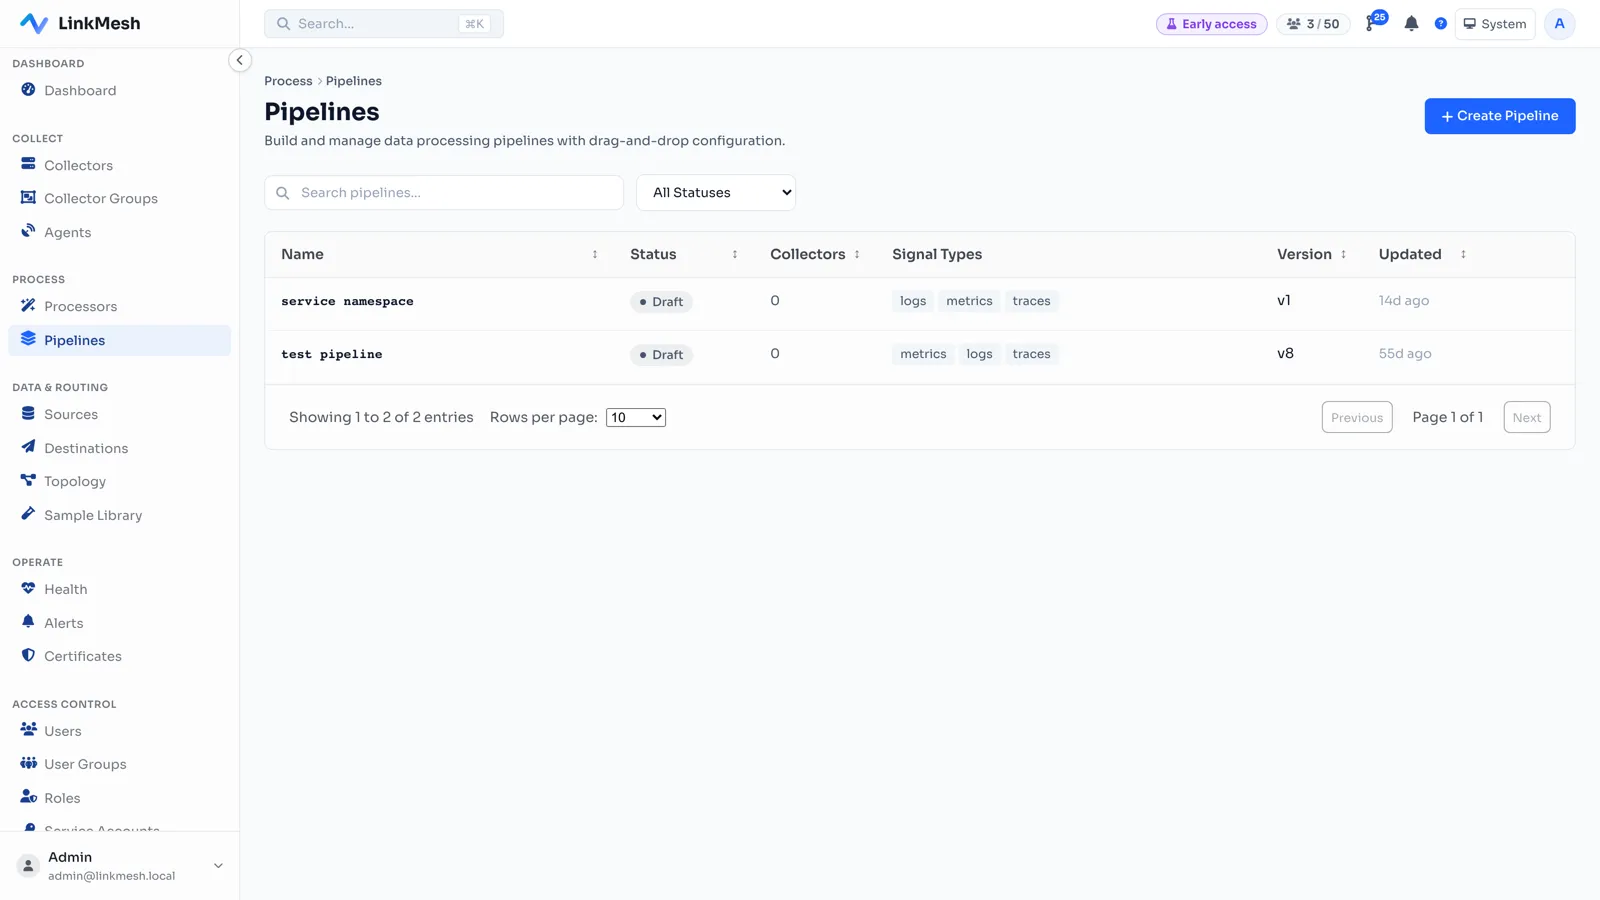
You compose the pipeline once in the builder, and the control plane renders and delivers it to each runtime:
The short version
Alloy and the OpenTelemetry Collector aren’t really rivals — Alloy is an OTel Collector distribution with the Grafana ecosystem attached. Pick Alloy for the Grafana/Prometheus world and its UI; pick otelcol-contrib for the broadest, purest OTel footprint; run both when your estate is mixed. The thing that keeps “both” from becoming a headache is a single control plane that manages each runtime natively.
See the Features page, grab a binary from Downloads, or stand up a control plane and enroll your first collector — Alloy or otelcol — at linkmesh.io/install.