
 LinkMeshObservability Data Collection Management
Reduce Observability Costs
Filter, sample & route before the bill.
 Philippe Braxmeier← Back to blog
Observability bills have a nasty property: they grow with your success. More traffic, more services, more telemetry — and because most vendors charge by the gigabyte ingested, the invoice climbs faster than the value you get from the data. The good news is that most of that volume is noise you’re paying to store and never query.
This is a practical playbook for cutting observability spend without going blind: measure where the volume is, filter the noise, sample what’s high-volume, and route data to destinations priced for how you actually use it — all before it reaches an expensive backend.
Where the money actually goes
Vendor pricing usually stacks three charges: ingest (per GB accepted), index (making it searchable), and retention (keeping it around). The ingest number is the one that scales directly with volume, and it’s where a pipeline helps most.
A quick, illustrative bit of math. Say you ship 1 TB of logs per day and your backend charges on the order of $0.50 per GB ingested:
1,000 GB/day × $0.50/GB = $500/day ≈ $15,000/monthNow suppose 60% of those logs are DEBUG lines, health-check spam, and successful
load-balancer pings that nobody ever queries. Dropping them before ingest takes that
same bill toward $6,000/month — for data you’d never have looked at. The exact
numbers vary by vendor and plan, but the shape is always the same: volume is the
lever, and the cheapest gigabyte is the one you never send.
Logs and traces are a volume game; metrics are a cardinality game. Every unique combination of label values is a separate time series to store, and a single high-cardinality label — a user ID, a request ID, a raw URL — can multiply your metrics bill by orders of magnitude. The same pipeline that filters log volume can drop or aggregate away runaway labels before they explode into millions of series.
Step 1 — Measure: you can’t cut what you can’t see
Before deleting anything, find out where the volume actually comes from. Blind cutting is how you accidentally drop the one log line you needed during the next incident. You want per-source and per-route throughput: which pipeline, which service, which log stream is generating the gigabytes.
Volume is almost always lopsided: a handful of services or log streams generate the bulk of it. Find those first — the top few talkers usually account for the majority of the bill, and fixing them is where the effort pays off. Chasing a low-volume stream to shave a rounding error off the invoice is wasted work.
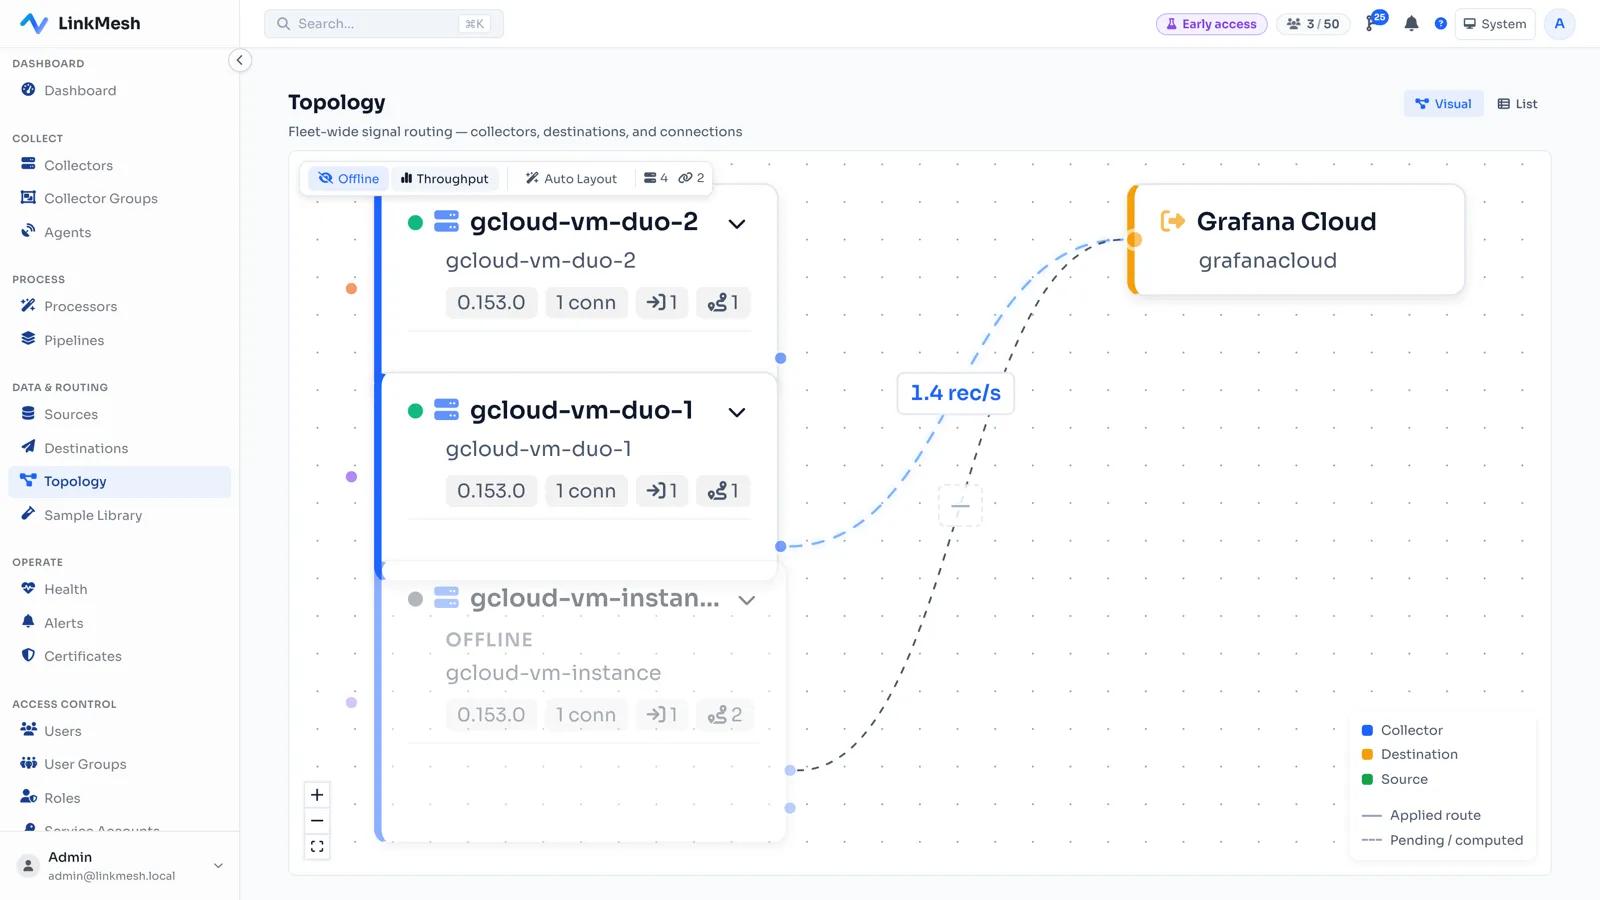
A telemetry pipeline with per-edge throughput turns this from guesswork into a number you can point at. LinkMesh shows records per second on every edge of the topology, so you can see exactly where volume enters and what reaches each destination:
Step 2 — Filter: drop the noise at the edge
The biggest, safest win is dropping data you never use, as early as possible. Debug logs in production, health-check requests, chatty third-party components, verbose success events — filter them at the collector, before they cost you anything downstream.
With the OpenTelemetry Collector’s filter processor, dropping sub-INFO logs is a few
lines:
processors:
  filter/drop_debug:
    logs:
      log_record:
        - 'severity_number < SEVERITY_NUMBER_INFO'
You can filter on any attribute — drop health-check URLs, a noisy namespace, or spans from a synthetic monitor. The rule of thumb: if no dashboard, alert, or investigation ever reads a category of data, it shouldn’t be in your paid backend.
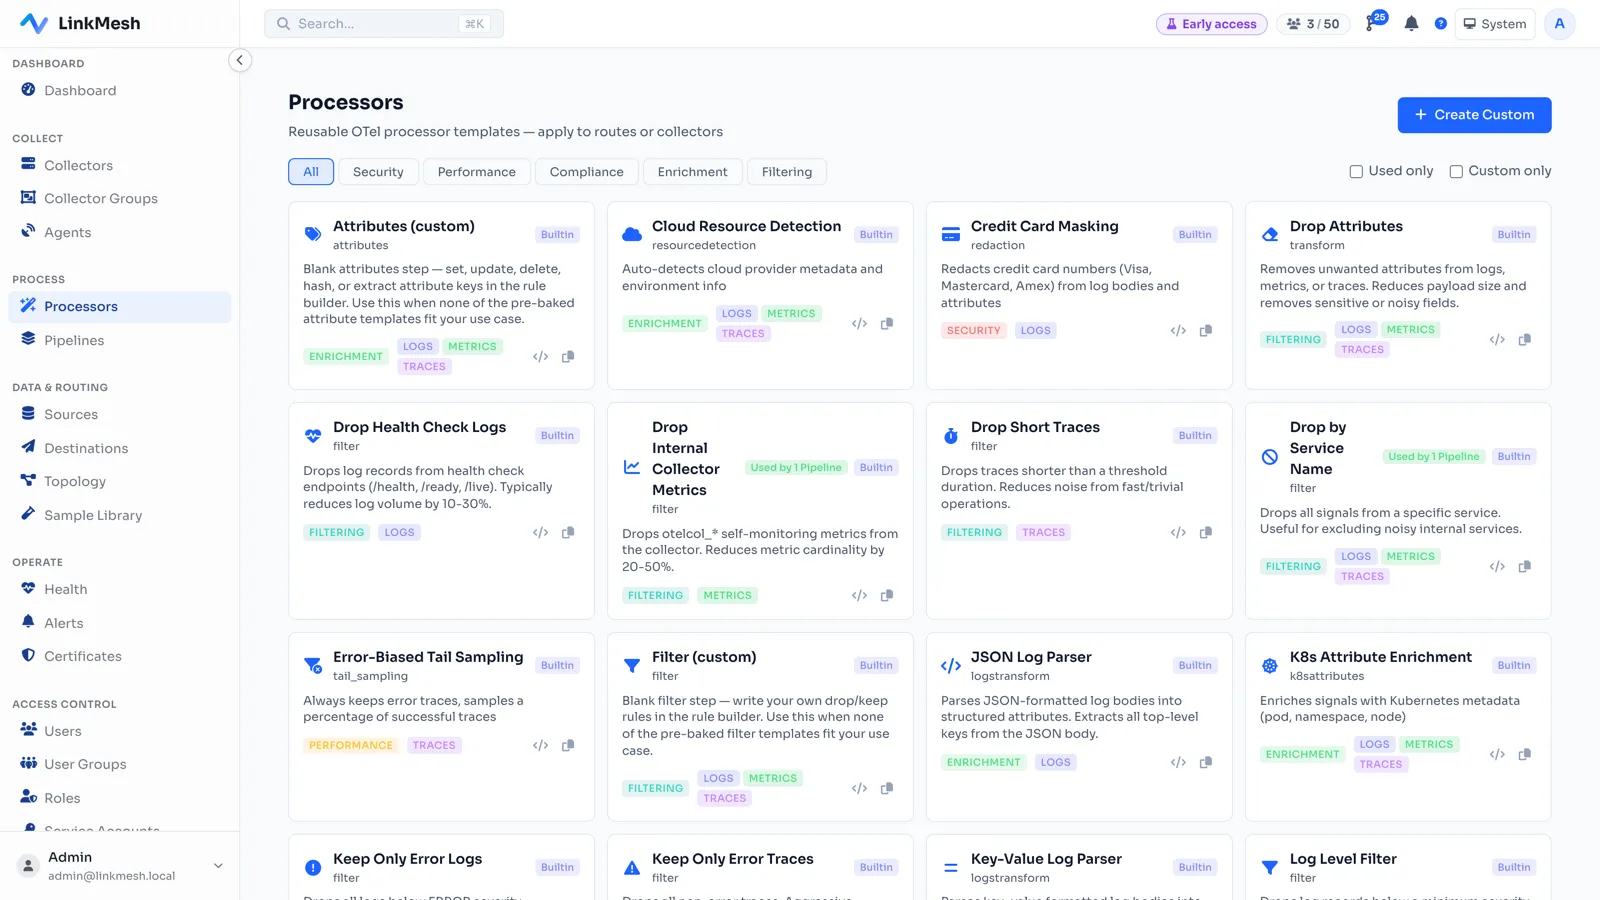
Filtering isn’t only about whole records. Fat log lines and bloated resource
attributes add up too — dropping unused attributes with the attributes or
transform processor trims every record you do keep. Redacting sensitive fields
(worth doing for compliance anyway) shrinks payloads as a side effect. Smaller
records mean lower ingest, across the whole stream.
Step 3 — Sample: keep the signal, drop the bulk
Some data is useful in aggregate but ruinous to keep in full — high-volume traces, successful requests, repetitive info logs. Sampling keeps a representative fraction. Head-based sampling is the simplest: decide at ingest, cheaply, with a fixed rate.
processors:
  probabilistic_sampler:
    sampling_percentage: 15
That keeps 15% of the flow and drops the rest before it’s ingested. For traces you can get smarter with tail sampling — keep 100% of errors and slow requests, sample the fast successful ones — at the cost of buffering. Start with head sampling on your highest-volume, lowest-value streams; it’s the fastest lever after filtering.
The guardrail is to never sample blindly. Keep 100% of errors, anything slow, and anything security-relevant; sample only the boring, successful, high-volume majority. A pipeline that lets you set the rule per-route — full fidelity on the error path, aggressive sampling on the happy path — is what makes sampling safe rather than scary.
Step 4 — Route: send data to the destination its value deserves
Not all telemetry deserves your premium, indexed, fast-query backend. A lot of it exists for compliance or the occasional deep dive — it needs to be retained, not queryable in 200ms. Routing lets you split the stream by value:
- Premium backend — the ~10% you actively query: dashboards, alerts, live debugging. Fast, indexed, expensive per GB.
- Cheap archive — object storage (S3 and friends) for compliance and rainy-day forensics. Pennies per GB, slower to query, and that’s fine.
Sending everything to the premium tier “just in case” is where a huge amount of observability money quietly evaporates. Route by value and the expensive backend only pays for what earns its place.
A common split: application error logs and the metrics behind your SLOs go to the premium tier; full-fidelity access logs and audit trails go to object storage, queried only when an auditor or an incident asks. Same data retained, a fraction of the cost — you’ve just stopped paying premium rates to store data at rest.
That split is a routing decision, not a filtering one — you’re not dropping the access logs, you’re sending them somewhere cheaper. For how the routing side works in practice — a priority-ordered condition cascade, built with a field/operator/value picker instead of hand-written OTTL — see Route Telemetry by Attribute.
Verifying the drop
Every step above is reversible and worth measuring, so close the loop: compare per-route throughput before and after each change. If filtering a namespace cut a route from 8,000 to 3,000 records per second and every dashboard still works, that’s a real, provable saving — not a hopeful config edit.
This is where a pipeline with built-in measurement pays for itself twice. LinkMesh shows per-processor drop counts and per-edge throughput, so you can watch a filter take effect and confirm the volume actually fell — and that you didn’t break anything downstream in the process. (For the fundamentals behind these stages, see our telemetry pipeline guide.)
Where to start
Effort should follow impact, so do these in order:
- Measure your top few highest-volume routes.
- Filter debug logs and health-check noise — the biggest safe win.
- Sample the high-volume, low-value streams that survive filtering.
- Route retain-only data to cheap storage, keep the queried slice premium.
Most teams get a large cut from steps 2 and 3 alone, before touching anything risky — and because each step is measured, you can prove the saving and prove you didn’t break a dashboard doing it.
One more lever: don’t let the tool that saves money also charge by volume
There’s an irony worth naming. Plenty of pipeline tools that help you cut ingest are themselves priced by the volume they process — so the tool you bought to control cost has a bill that also grows with your data.
LinkMesh is priced per managed collector, not per gigabyte, so shrinking your telemetry is pure savings: it cuts your backend bill and never raises ours. See pricing for the model, or stand up a control plane and start measuring — and cutting — your volume at linkmesh.io/install.