LinkMesh

Search docs, blog and changelog

ENDE

OpenTelemetry Fleet Management

Manage your OpenTelemetry Collector fleet from one place

A handful of collectors you edit by hand is fine. A fleet of them drifts, skews versions, and breaks at 2am. LinkMesh is a self-hosted, OpAMP-native control plane that configures, rolls out, and monitors every collector you run — standard otelcol-contrib and Grafana Alloy, priced per collector, not per gigabyte.

Start free →

25 Collectors free after a no-card registration · 5 without one How the free tier works

Managing 5 collectors is easy. Managing 50, 200, or 1,000 isn’t.

Every technique that works for a few collectors — SSH in, edit the file, restart — stops working somewhere between the tenth and the fiftieth. These are the failure modes that show up next.

Config drift

One host gets a processor the others miss; a receiver port changes on three nodes out of forty. Nobody can say what "the config" even is anymore.

Version skew

Half the fleet is on last quarter’s collector build, the other half on this one, and a bug only reproduces on the hosts you forgot to upgrade.

SSH-driven ops

Every change is a shell session times N hosts, followed by a restart you hope succeeded. It doesn’t scale and it leaves no audit trail.

No inventory

Ask how many collectors you run, on what version, in which environment — and the honest answer is a spreadsheet that’s three weeks stale.

No staged rollout

A new config goes to every collector at once. A bad receiver takes down ingestion everywhere at 2am, with no canary and no blast-radius control.

No rollback

"Who changed the sampling rule, when, and can we undo it?" shouldn’t require reading shell history on forty boxes.

Where LinkMesh sits

LinkMesh is a control plane, not a data plane. Configuration and health flow between the fleet and the LinkMesh server over OpAMP and remotecfg; your telemetry flows straight from the collectors to your own backends and never passes through LinkMesh.

CONTROL PLANE · OpAMP + remotecfgLinkMesh Serveryour self-hosted control plane · config, rollout, drift, healthRemoteConfigEffectiveConfig · HealthDATA PLANE · OTLP (never through LinkMesh)Sourceshosts · Kubernetescloud · syslog · appsCollector Fleetotelcol-contribvia OpAMPGrafana Alloyvia remotecfgYour BackendsLoki · TempoPrometheus · SplunkGrafana Cloud · …telemetrytelemetry
Sources feed the collector fleet, which sends telemetry straight to your backends. LinkMesh pushes config down and reads health back — out of the data path.

01

Configuration consistency

Problem

When every collector is edited by hand, they diverge. There is no single artifact you can point to and call "the fleet’s configuration".

LinkMesh

Define configuration once — per group, per environment — and LinkMesh renders and pushes the same effective config to every collector in it. otelcol-contrib receives it over OpAMP; Grafana Alloy pulls it over remotecfg. Standard upstream builds, no forked collector or proprietary agent.

One source of truth for the fleet. What you set is what runs — on node 1 and on node 400.

How a Collector is modelled in LinkMesh →
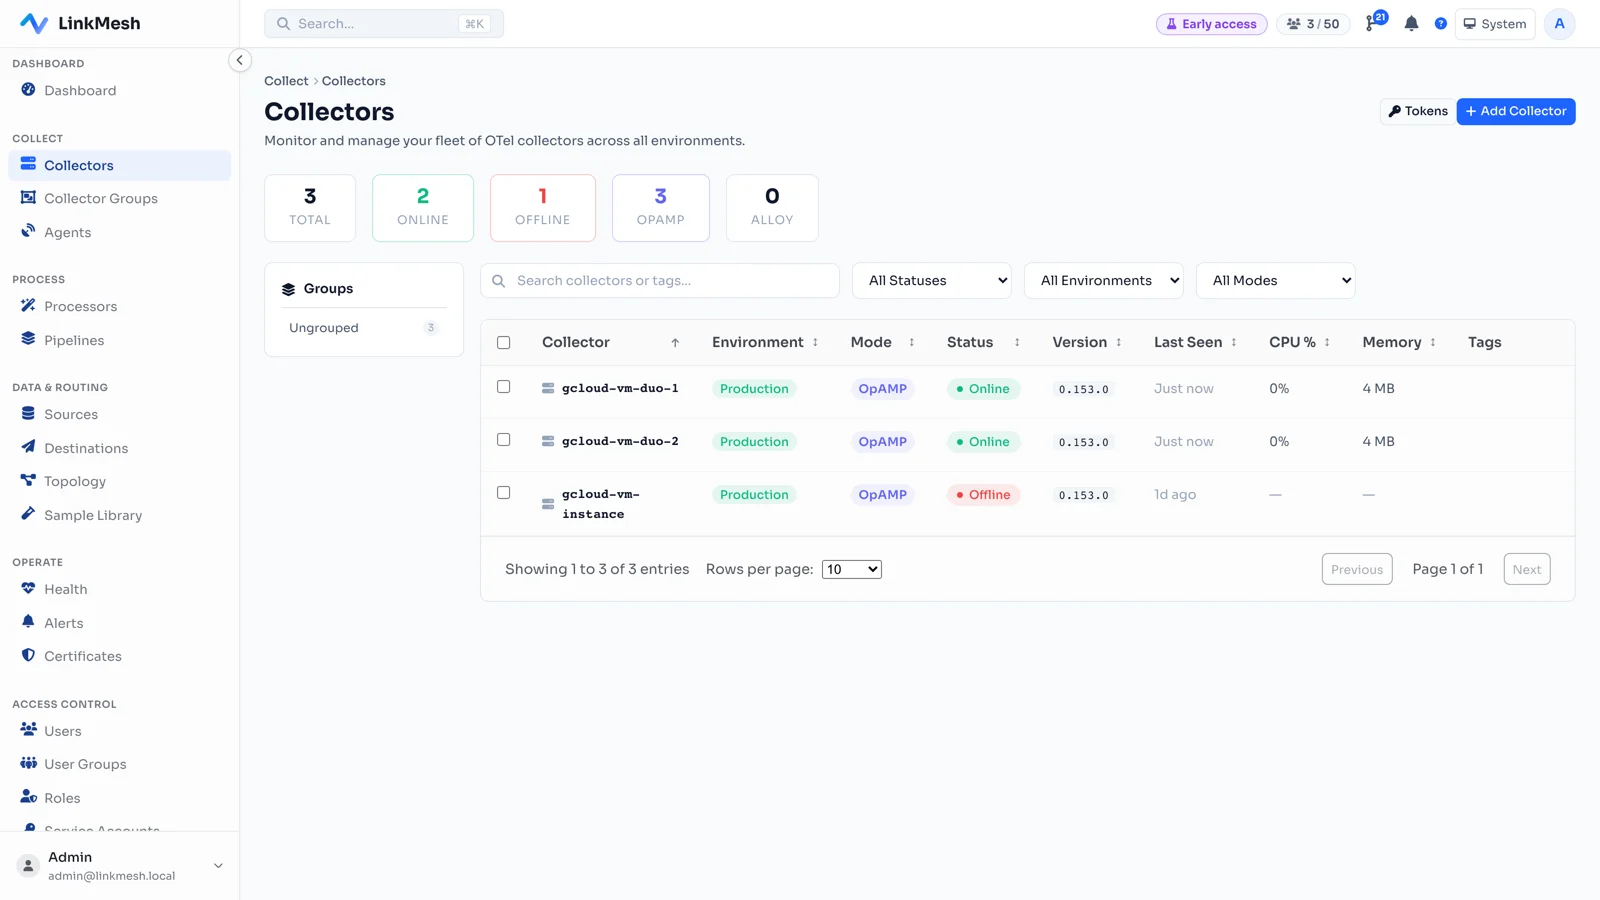
The LinkMesh Collectors view — a fleet of OpenTelemetry collectors showing status, version, last-seen, CPU, and memory for every node.
The fleet view: status, agent version, and host footprint for every managed collector.

02

Staged rollouts

Problem

Pushing a config change to hundreds of collectors at once is how a single bad receiver takes down ingestion across the estate.

LinkMesh

Roll a change out to one group first — a canary environment or a single region — watch health and effective-config convergence, then promote it to the rest. Every collector reports its EffectiveConfig and health back over OpAMP, so you see the change land before you widen it.

Ship configuration the way you ship code: small blast radius, observed, promoted deliberately.

How-to: stage a fleet-wide config change →

03

Configuration drift detection

Problem

A collector’s running config quietly diverges from what you pushed — a local override, a manual SSH edit, a half-applied change. You find out when telemetry stops arriving.

LinkMesh

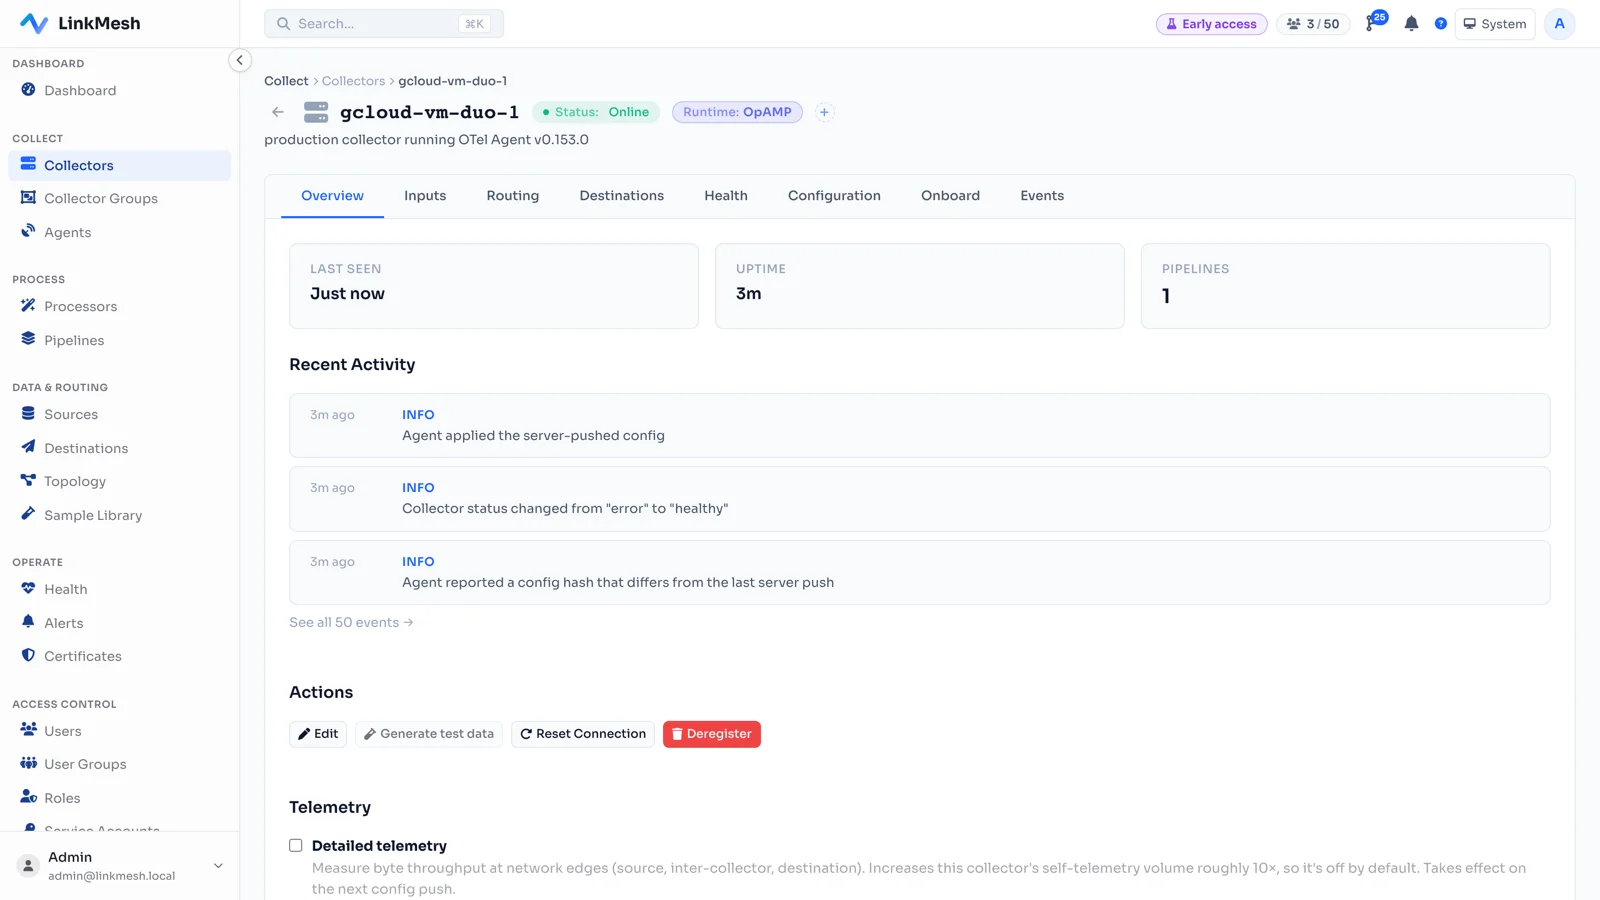
LinkMesh compares each collector’s reported EffectiveConfig hash against the config it was assigned and flags the mismatch. The collector timeline shows exactly when a node reported a hash that differs from the last server push, and when it re-converged.

Drift becomes a visible event on a timeline, not a silent outage.

How effective-config reconciliation works →
A LinkMesh collector detail page for gcloud-vm-duo-1, status Online, runtime OpAMP, whose activity log shows the agent applying the server-pushed config and, separately, reporting a config hash that differs from the last server push.
A collector’s timeline: the agent applies a server-pushed config, and a later drift event where its reported hash diverges.

04

Collector inventory & environments

Problem

You cannot manage what you cannot list. The fleet’s size, versions, and placement live in people’s heads and a stale spreadsheet.

LinkMesh

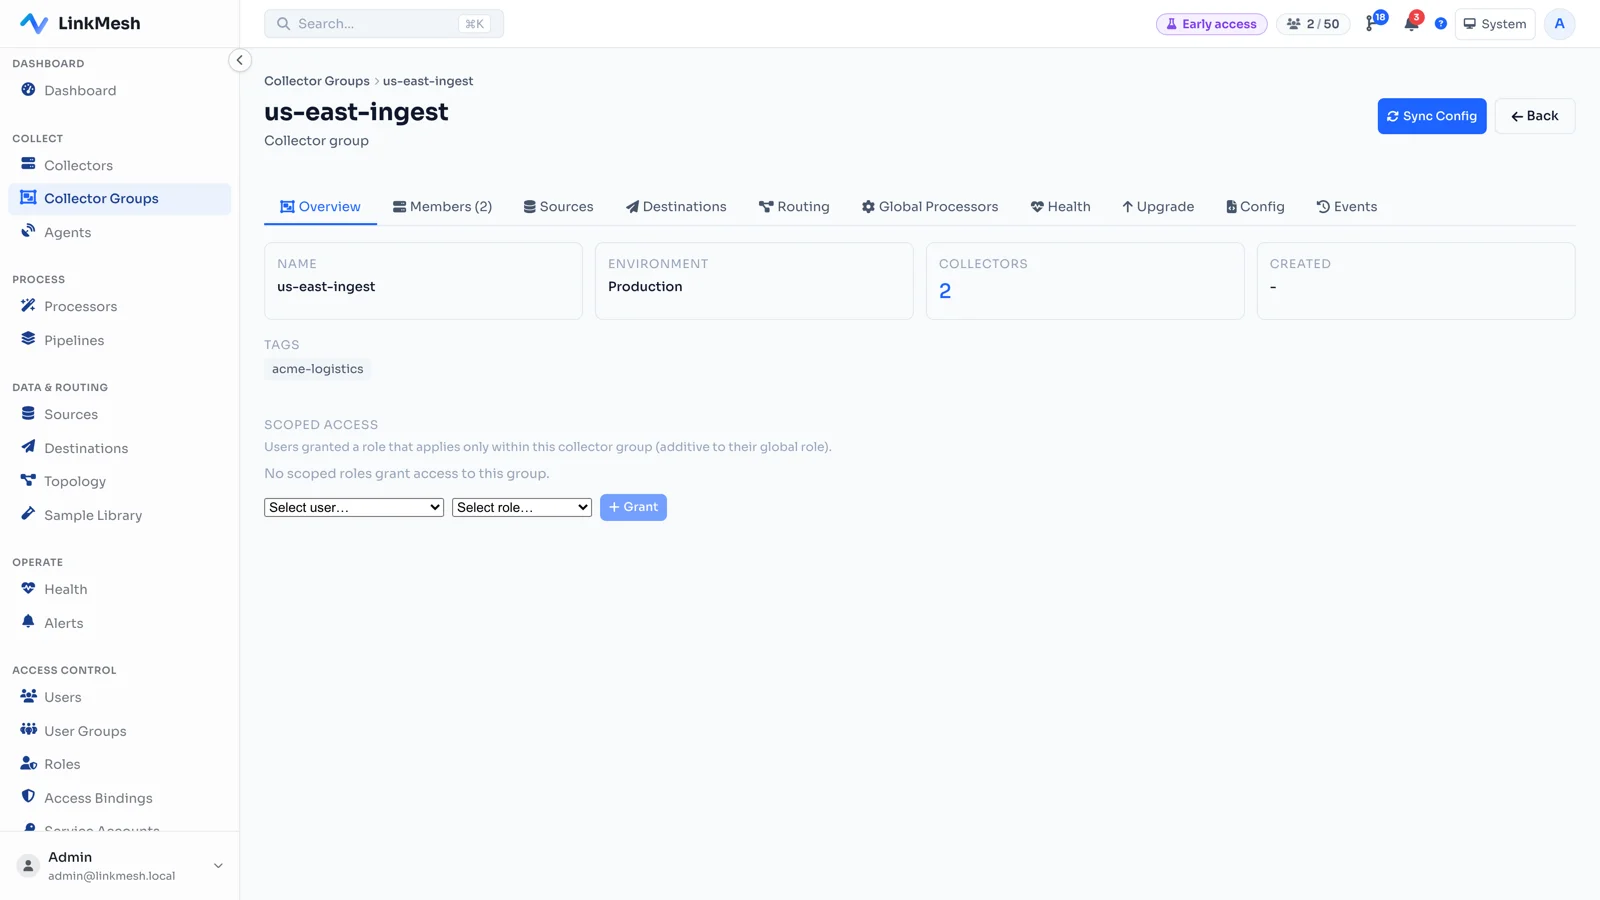
Every enrolled collector is inventoried automatically — status, agent version, last-seen, host, and the group and environment it belongs to. Organize the fleet into groups (production, staging, per-region, per-tenant) and scope user access per group.

A live inventory of your telemetry edge that never goes out of date.

How collector groups and environments work →
The LinkMesh collector group overview for us-east-ingest — environment Production, two collectors, an acme-logistics tag, and per-group scoped access controls.
A collector group: environment, membership, tags, and scoped access — the unit you configure and roll out against.

05

Remote configuration — OpAMP + Alloy remotecfg

Problem

Configuring collectors means SSH, a config file per host, and a restart you hope succeeds. It doesn’t scale, and it audits nothing.

LinkMesh

LinkMesh is an OpAMP control plane. otelcol-contrib connects with the standard opampsupervisor over a single outbound port-443 connection; Grafana Alloy pulls the same managed config over its native remotecfg endpoint. RemoteConfig, connection settings, and health all flow over the protocol — no inbound ports, no SSH.

One outbound connection per collector replaces a fleet of SSH sessions.

How LinkMesh speaks OpAMP →
CONTROL PLANE · OpAMPLinkMesh Serveryour hosted instanceOpAMP Serverendpoint /v1/opamptransport WSS · port 443OTel Hostopampsupervisor + otelcol-contrib:4317 OTLP / gRPC:4318 OTLP / HTTP:8888 own metricsRemoteConfig · Connection SettingsEffectiveConfig · Health · StatusDATA PLANE · OTLPlogs · metrics · tracesYour Observability BackendsLoki · Tempo · Prometheus · Grafana Cloud · …

06

Change history & rollback

Problem

"Who changed the sampling rule, when, and can we undo it?" should be a one-click answer, not a forensic exercise.

LinkMesh

Every route, pipeline, processor, and destination edit lands as a commit in the GitOps config repo — full diff, author, and timestamp. Roll back to any previous revision and re-push it to the fleet.

Git-grade change history and one-click rollback for your whole telemetry configuration.

How config is versioned in Git →

07

Policy enforcement

Problem

A team ships a collector that forwards raw logs — PII included — straight to a backend, bypassing every masking and sampling rule you agreed on.

LinkMesh

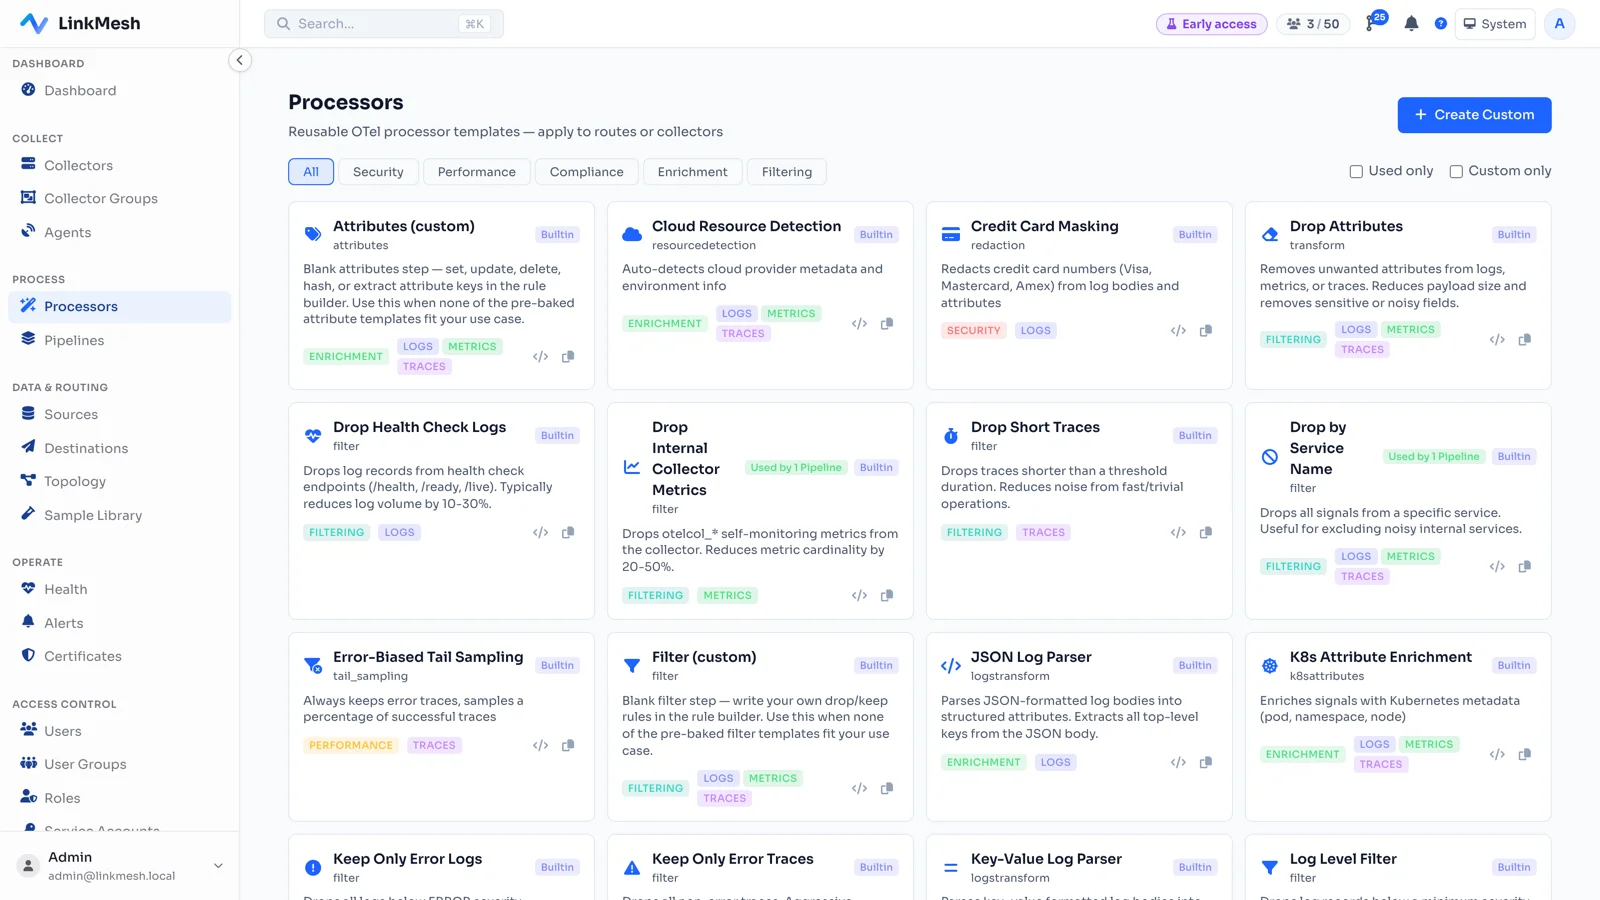
Attach global processors to a group so masking, filtering, and sampling apply to every collector in it, independent of the local pipeline. New collectors inherit the group’s policy the moment they enroll.

Guardrails that hold across the fleet, not conventions people forget.

How-to: enforce masking before egress →
The LinkMesh processor library, including built-in masking, filtering, and sampling templates that can be attached to a collector group as global policy.
Processors attached at the group level become policy every collector in the group inherits.

08

Multi-backend routing

Problem

Security wants logs in Splunk, SRE wants metrics in Prometheus, finance wants slow queries in BigQuery — all from the same sources.

LinkMesh

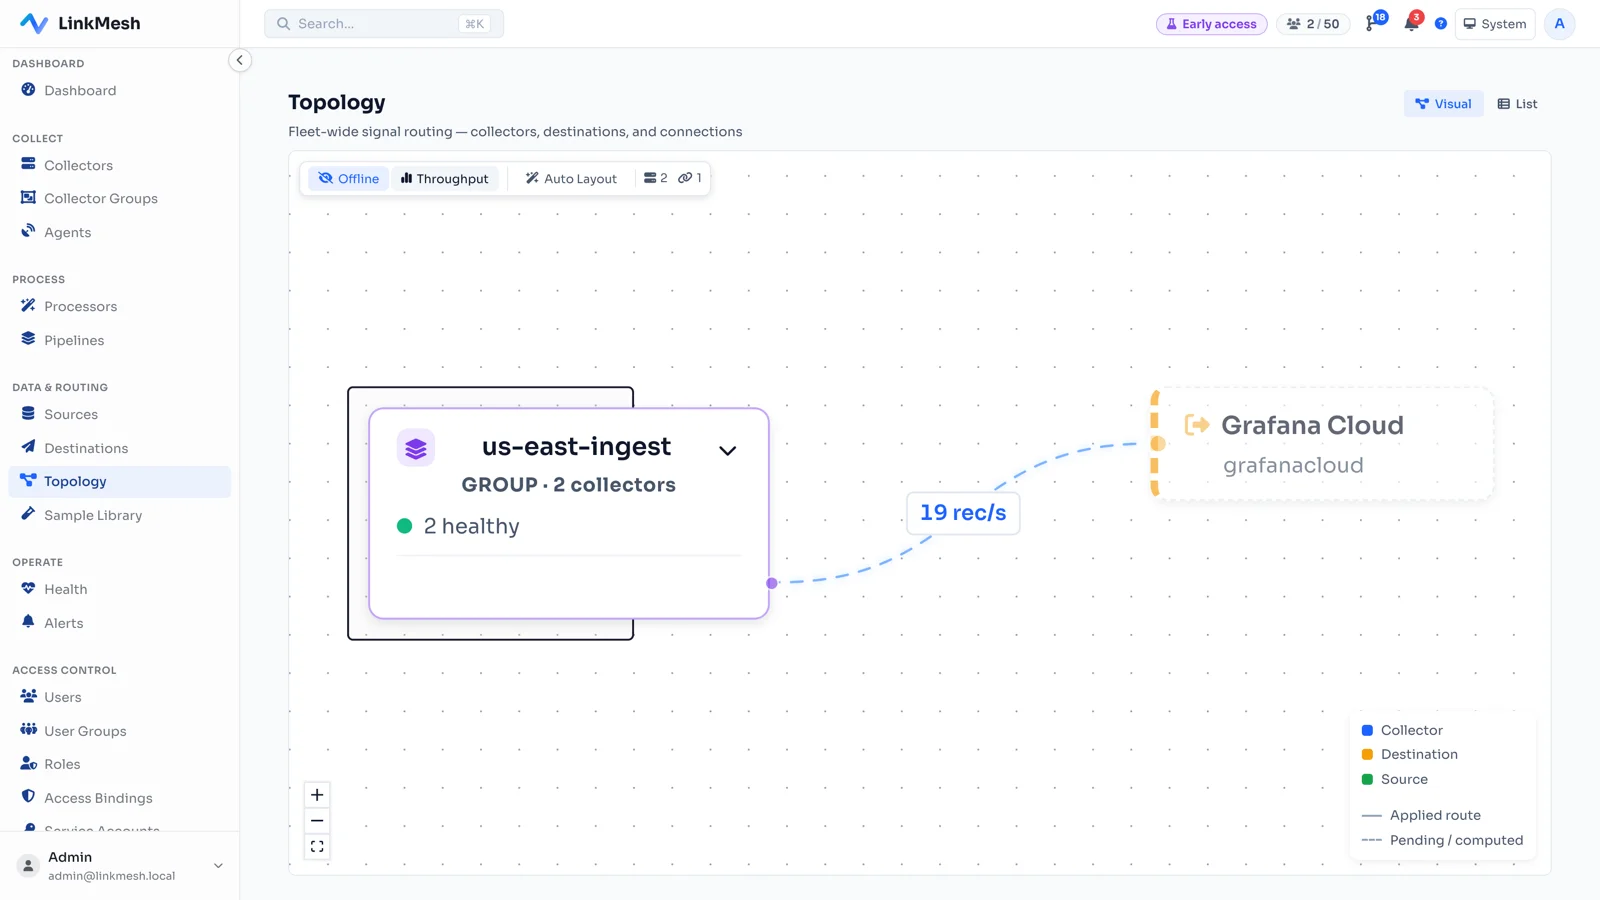
Define routes by label, environment, or tenant; the same collector fans out to multiple destinations with a different processing chain per route. The topology view shows live throughput on every edge.

One fleet, many backends, no per-team collector sprawl.

How-to: route telemetry to multiple backends →
The LinkMesh topology view — a collector group routing telemetry to a destination, with live records-per-second measured on the connecting edge.
The topology: collectors routed to destinations, with live throughput on every edge.

What LinkMesh is — and what it isn’t

What it is

A self-hosted control plane that configures, versions, rolls out, and monitors your OpenTelemetry Collector fleet. It manages the collectors — standard otelcol-contrib and Grafana Alloy — over OpAMP and remotecfg, from one place.

What it isn’t

It is not a telemetry backend or data store. LinkMesh does not ingest, index, or retain your logs, metrics, or traces — the collectors do that work and send it straight to your own backends. Because it’s self-hosted, your telemetry never transits LinkMesh.

If nothing changes

Left alone, none of this gets cheaper: the volume grows on its own, the data that already left cannot be recalled, and each agent added is one more to remove later.

Once it is running

  • A per-collector bill that a volume spike does not move.
  • Sensitive fields masked on the host, before anything leaves the network.
  • Every config change a diff you can review and roll back.
  • Backends you can swap, because nothing proprietary sits in the path.

Common questions

Does LinkMesh require a proprietary collector or agent?

No. LinkMesh manages standard OpenTelemetry collectors — otelcol-contrib over OpAMP and Grafana Alloy over remotecfg. There is no forked build and no vendor agent to install; you run the upstream binaries and LinkMesh configures them.

Can LinkMesh manage Grafana Alloy?

Yes. Alloy is enrolled over its native remotecfg endpoint and managed side by side with otelcol-contrib collectors that connect over OpAMP. The same rendered configuration is delivered to each over its own protocol.

Is my telemetry sent through LinkMesh’s cloud?

No. LinkMesh is self-hosted and carries only configuration, health, and status over the OpAMP control plane. Your collectors send logs, metrics, and traces directly to your own observability backends — the telemetry never transits LinkMesh.

How is LinkMesh priced?

By managed collector, never by data volume. The first 25 collectors are free after a no-card registration in the OpenSight Customer Portal (5 without one); beyond that it is a flat USD 12.50 · CHF 12.00 · EUR 12.50 per collector per month, billed annually, and the bill stops growing at 200 collectors.

Does LinkMesh work air-gapped or fully on-premises?

Yes. LinkMesh runs entirely on your own infrastructure with no dependency on a LinkMesh SaaS. Collectors connect outbound to your LinkMesh server over a single port-443 connection, so it works in isolated and air-gapped networks as long as the collectors can reach that server.

What does LinkMesh manage, and what does it not?

LinkMesh configures, versions, rolls out, and monitors your OpenTelemetry Collector fleet. It is not itself a telemetry backend or data store: it does not ingest, index, or retain your logs, metrics, or traces. The collectors do the telemetry work; LinkMesh manages the collectors.

Bring your Collector fleet under one control plane

Self-hosted, OpAMP-native, and priced per collector. The first 25 Collectors are free after a no-card registration in the OpenSight Customer Portal (5 without one).

Install the control plane on any Linux VM — Ubuntu / Debian

curl -fsSL https://artifacts.saas.opensight.ch/binaries/linkmesh-server/latest/linkmesh-server_latest_amd64.deb -o linkmesh-server.deb && sudo apt install -y ./linkmesh-server.deb

RHEL / Rocky / AlmaLinux, collector enrollment, and the full walkthrough: Install guide →

Start with one test collector.

Save the current configuration, connect one collector and verify a real signal in your backend. Test one change and its rollback before expanding to the fleet.

Setup guides and evaluation checklist

No email required for the download. Includes failure tests, rollback and checks for ingest-cost assumptions.