LinkMesh

Features

Four problems. One control plane.

LinkMesh is shaped around the four jobs every platform team eventually has to do with their telemetry. Each gets a first-class capability — not a plugin, not a partner integration, not a roadmap promise.

01

Collector Fleet Management

Problem

OpenTelemetry Collectors are great per-host, but managing dozens or hundreds across a fleet means manual config drift, version skew, and SSH-driven ops.

LinkMesh

Enroll every Collector with the LinkMesh control plane over a single port-443 connection — otelcol-contrib via OpAMP, Grafana Alloy via remotecfg. The fleet UI shows status, version, throughput, and config state for every node. Push config changes from one place; collectors apply them with hot-reload where possible, restart where needed.

No SSH. No drift. One pane of glass for every Collector your platform team manages.

How a Collector is modelled in LinkMesh →
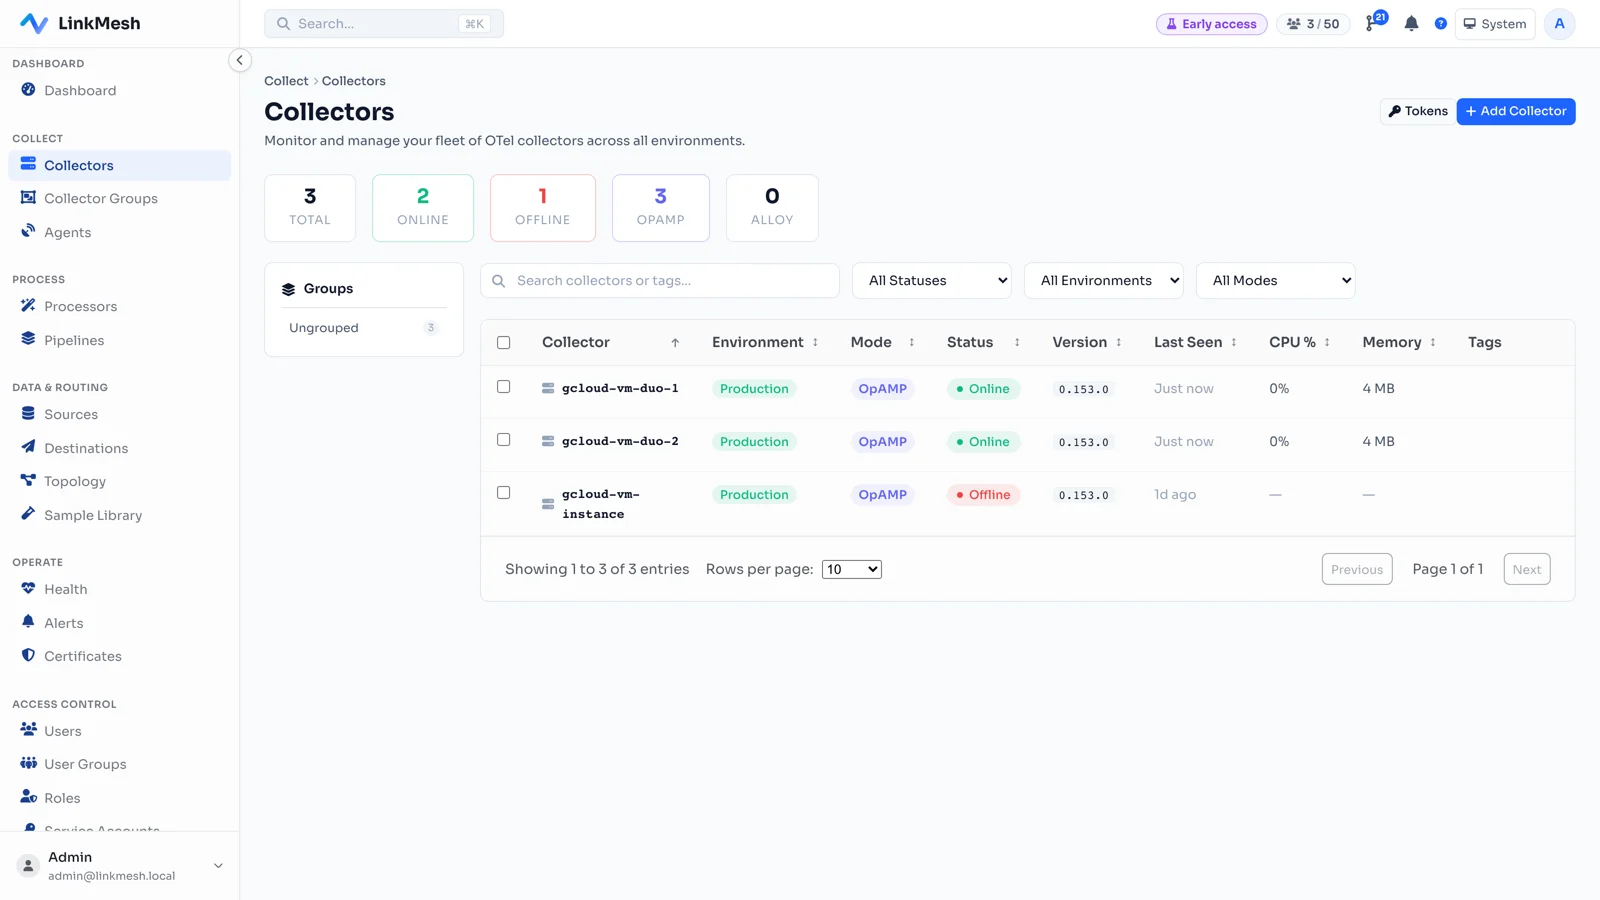
The LinkMesh Collectors view — a fleet of OpenTelemetry collectors showing status, version, last-seen, CPU, and memory for every node.
The fleet view: status, version, and host footprint for every managed Collector.

02

PII Masking

Problem

Sensitive fields — credit cards, emails, phone numbers, internal IDs — slip into logs all the time. They reach observability backends where they're indexed, retained, and eventually queried by people who shouldn't see them.

LinkMesh

Apply masking processors at the Collector level, BEFORE telemetry leaves the host. Built-in templates for credit cards, emails, phone numbers; custom regex/OTTL rules for your specific fields. Masking runs client-side in customer infrastructure — sensitive values never reach the network.

Compliance-friendly by construction. Your security review takes minutes instead of months.

How-to: mask PII before egress →
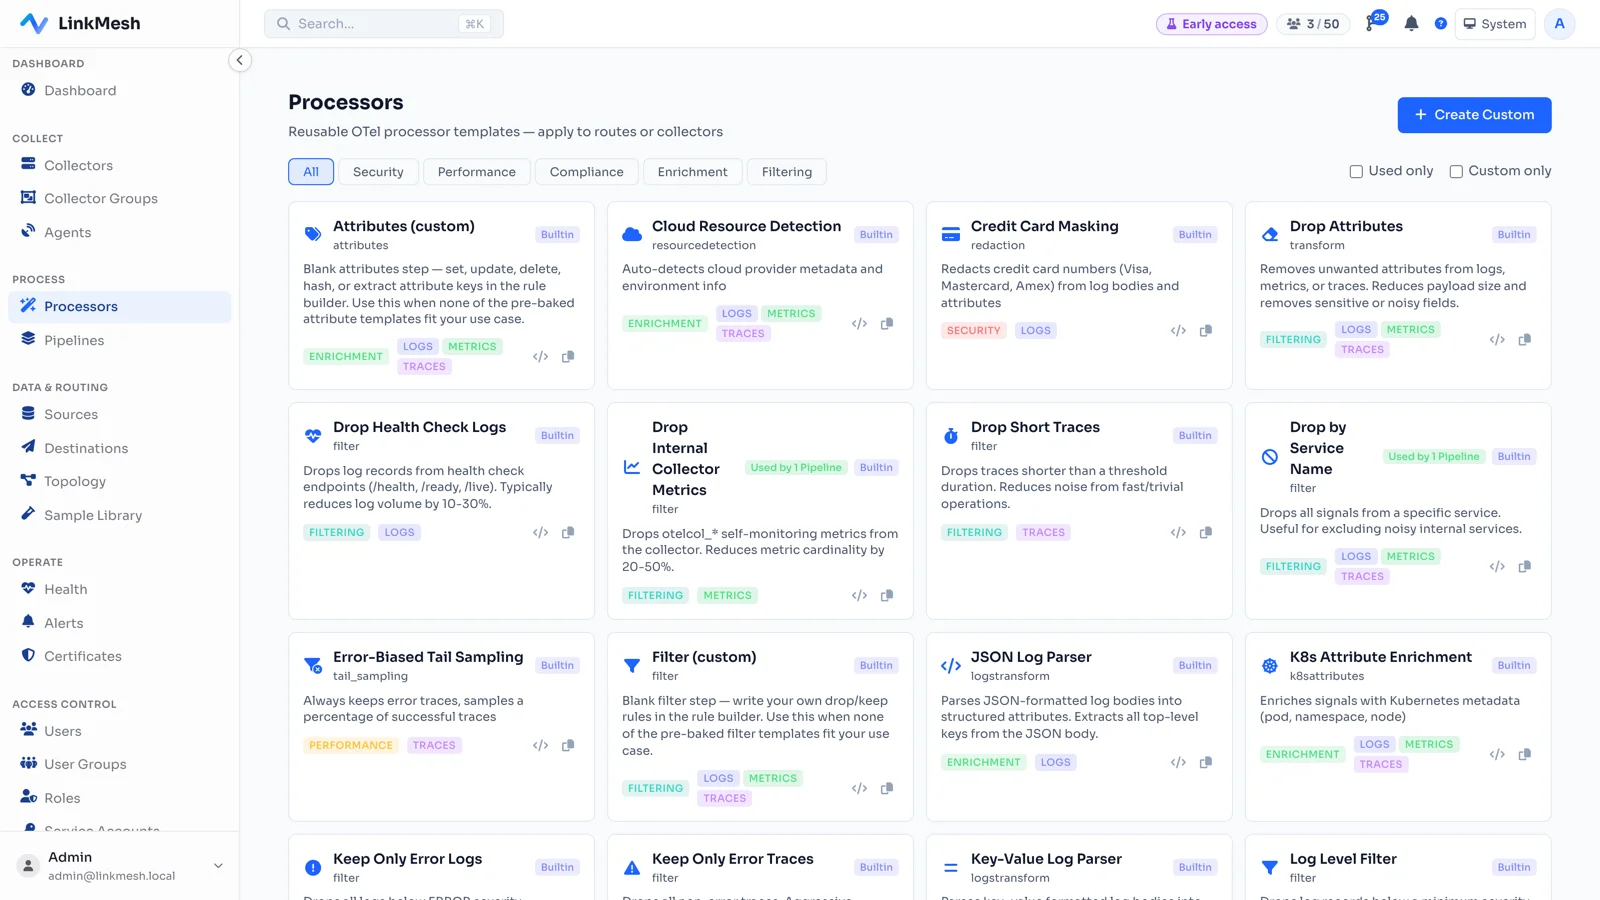
The LinkMesh processor library, including a built-in Credit Card Masking template that redacts Visa, Mastercard, and Amex numbers from log bodies and attributes.
Built-in masking templates — like Credit Card Masking — apply at the source, before egress.

03

Telemetry Refinement

Problem

Most telemetry is noise. Health checks, polling, debug logs, retry storms — they bloat your retention bill and bury the signals you actually need.

LinkMesh

Drop, sample, aggregate, and rate-limit at the source. Filter rules that read clean (drop where service.name = "health-check") instead of OTTL spaghetti. Per-component throughput metering at every stage — receivers, processors, exporters — so you can see exactly where volume is reduced.

Reduce volume before it hits your backend. Same signals, fraction of the storage cost.

How pipelines and processors compose →
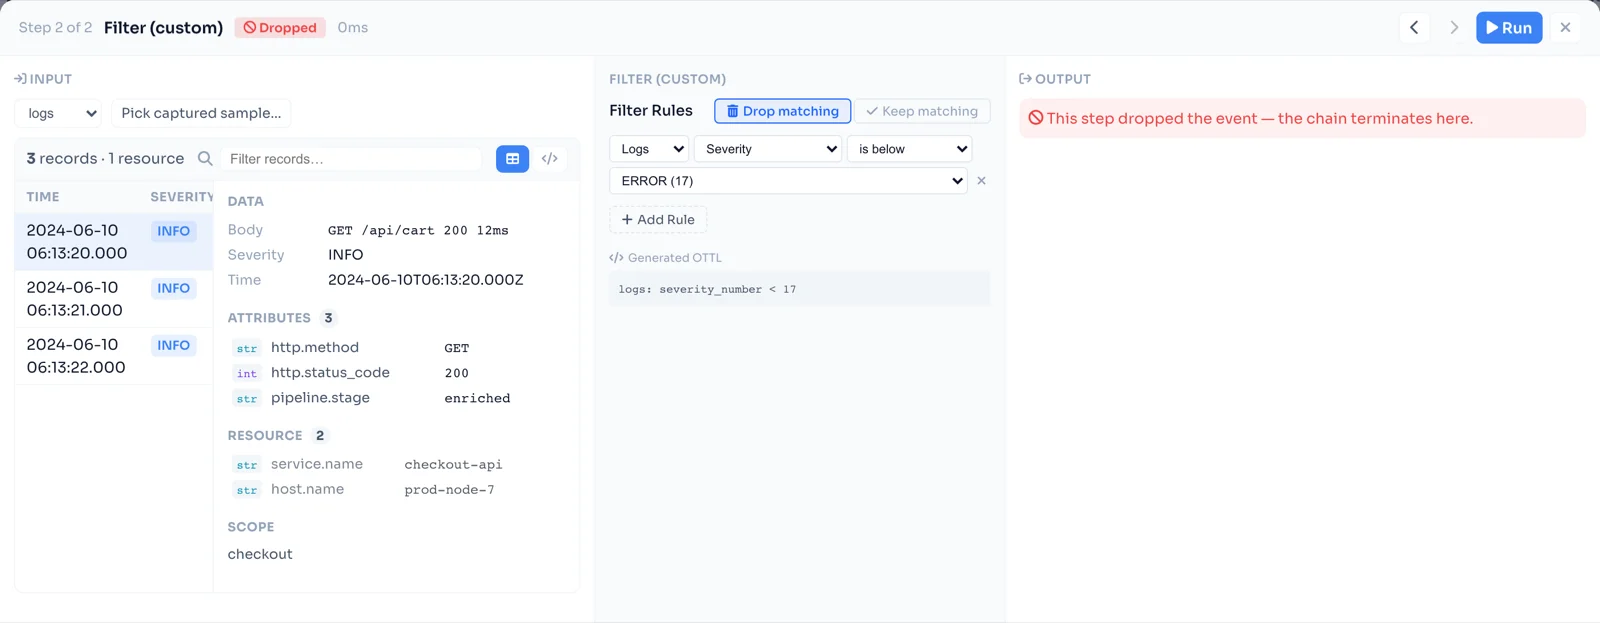
The LinkMesh processor preview — a sample log record entering a drop filter on the left, the rule and generated OTTL in the middle, and the dropped-event output on the right.
Preview a real record through a processor — input, rule, and output side by side — before you save.

04

Label-Based Routing

Problem

A single telemetry pipeline can't serve every team. Security wants logs in Splunk; SRE wants metrics in Prometheus; finance wants slow queries in BigQuery.

LinkMesh

Define routes by label, environment, tenant, or service. The same source can fan out to multiple destinations with different processing chains for each. Every route, pipeline, and destination edit lands as a Git commit in the GitOps config repo — full diff and authorship for every change.

One pipeline definition, many backends, predictable cost.

How-to: route to Grafana / Loki →
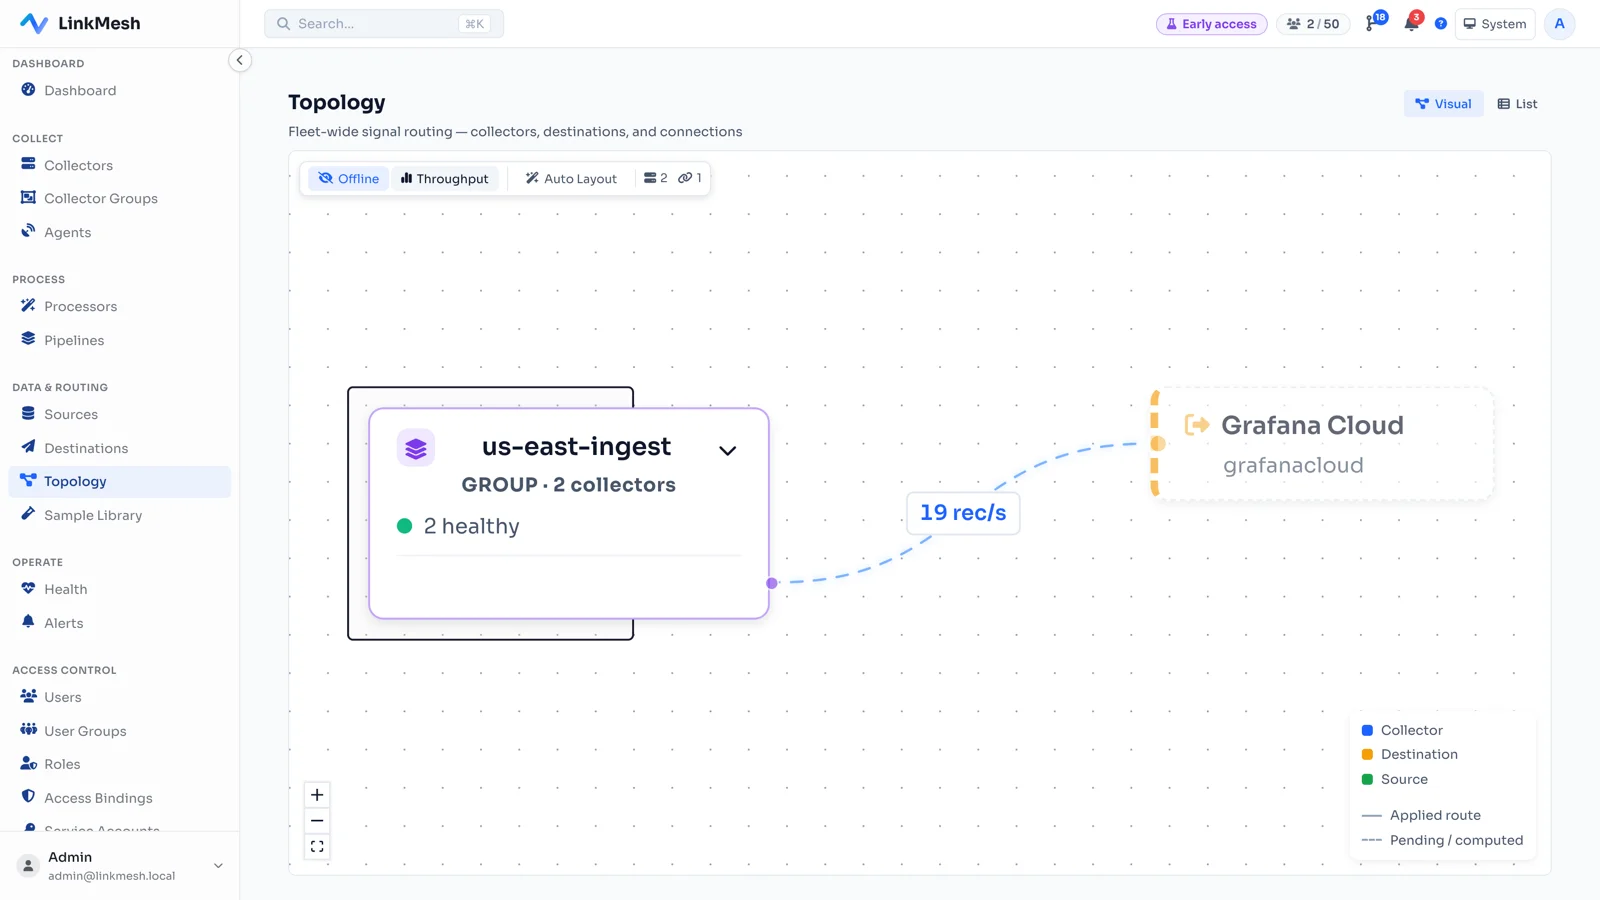
The LinkMesh Topology view — a collector group routing telemetry to a Grafana Cloud destination, with a live 19 records-per-second rate measured on the connecting edge.
The topology: collectors routed to destinations, with live throughput on every edge.

Ready to manage your Collector fleet from one place?

Install LinkMesh →