

 LinkMeshObservability Data Collection Management
OpAMP Explained
Remote-managing OpenTelemetry collector fleets.
 Roman Hüsler← Back to blog
Running one OpenTelemetry Collector is easy. Running fifty is a different job. Each one is a process on a host with its own config file, its own version, and its own way of quietly drifting out of line — and by default you have no central way to see any of it, let alone change it. OpAMP is the open standard built to close that gap.
This guide explains what OpAMP is, how the protocol actually works, the deployment models you can choose from (and which one is practical today), and — just as important — what OpAMP deliberately leaves for you to build on top.
The fleet problem: 50 collectors, 50 config files, zero visibility
The OpenTelemetry Collector is a great per-host building block. But that per-host strength becomes a fleet problem the moment you run more than a handful:
- No inventory. Which collectors are actually up? Which version is each on?
- No central config. Changing a pipeline means editing a file on every host — via Ansible, a playbook, or SSH — and hoping every node converged.
- Silent drift. A host that missed an update, or was hand-edited in an incident, just quietly runs the wrong config until data stops arriving.
You usually find out something’s wrong when telemetry goes missing. What you want is the opposite: one place that sees every collector’s status and pushes config to all of them, safely. That’s exactly the problem OpAMP standardizes.
What OpAMP is: status up, config down
OpAMP — the Open Agent Management Protocol — is an open specification (under the OpenTelemetry project) for remotely managing a fleet of agents. “Agent” usually means an OTel Collector, but OpAMP is agent-agnostic. It defines a client/server protocol with two directions of flow:
Up (agent → server): each agent reports who it is, its health, its currently effective configuration, and its telemetry about itself. This is what turns a pile of hosts into a live inventory.
Down (server → agent): the server can push a new remote configuration, updated connection settings, certificates, and even new agent packages (binary/version updates). This is what turns “edit fifty files” into “change it once, centrally.”
Under the hood this runs over a persistent connection (WebSocket or plain HTTP), secured with TLS, with the agent authenticating to the server — so the link is continuous, not a one-shot push. Because the agent reports its effective config back up, the server can compare what it asked for against what’s actually running — the basis for drift detection. That round-trip is the whole point: manage the fleet from one place, and know it worked.
Why not just use Ansible or Puppet? You can push a Collector config with generic config management — plenty of teams do. But those tools are fire-and-forget: they converge a file and move on. They give you no live connection back, so there’s no continuous health signal, no report of what config is actually effective on each host, and no standard way to ship a binary update or rotate a certificate. OpAMP is purpose-built for the agent-management loop — persistent connection, health heartbeat, effective-config report — which is exactly what makes real-time fleet visibility and drift detection possible in the first place.
Three deployment models — and the one that’s practical today
OpAMP is a protocol, so something on the host has to speak it. There are three shapes, and the difference matters a lot in practice.
1. Integrated client (the opampextension). The Collector ships with an OpAMP
extension that connects directly to the server. It’s the simplest to deploy — no
extra process. The important caveat: on its own, the extension reports status and
receives config messages, but it does not restart or hot-reload the Collector to
apply a new remote pipeline. So “integrated client” today gives you visibility and
partial management, not full remote-config application.
2. Supervisor (the opampsupervisor). A small separate process is the OpAMP
client; it runs the Collector as a child. When the server pushes new config, the
supervisor writes it to disk and restarts (or reloads) the Collector to apply it —
then reports the new effective config back up. This is the model that actually
delivers remote configuration management today, which is why it’s the practical
default for a real fleet.
3. Gateway / hierarchical. In larger topologies you run a gateway tier of Collectors that edge agents forward to. The gateway Collectors are themselves OpAMP-managed agents; this is a topology choice layered on top of the client models above, not a different way of speaking the protocol.
The headline: if you want to push config and have it applied, the supervisor is the model to build on right now. The extension-only path is improving, but assuming it already does full remote-config application is the most common OpAMP mistake.
What OpAMP does not give you
Here’s the part that trips people up: OpAMP is a protocol, not a product. It standardizes the wire — how an agent and a server talk. It does not hand you the server, and it deliberately leaves out everything above the wire:
- No UI. OpAMP moves config as opaque bytes; it has no opinion about how you view or manage the fleet.
- No config authoring or validation. Composing a valid Collector pipeline — receivers, processors, exporters — and checking it before you ship it is yours to build.
- No drift diffing or rollback UX. The protocol reports effective config; turning that into a readable “this host drifted, here’s the diff, roll it back” experience is a product concern.
- No RBAC, audit, or versioning. Who changed what, when, and who’s allowed to — all above the protocol line.
In other words, OpAMP gives you the transport for fleet management. The control plane — the UI, the config authoring, the validation, the drift view, the history — is the part you either build or adopt.
How LinkMesh implements OpAMP
LinkMesh is that control plane. It uses the supervisor-based model
so remote config is actually applied: point a Collector’s opampsupervisor at
LinkMesh with a token, and the collector shows up in the fleet. In other words, LinkMesh
is a self-hosted OpAMP server with the fleet tooling built on top.
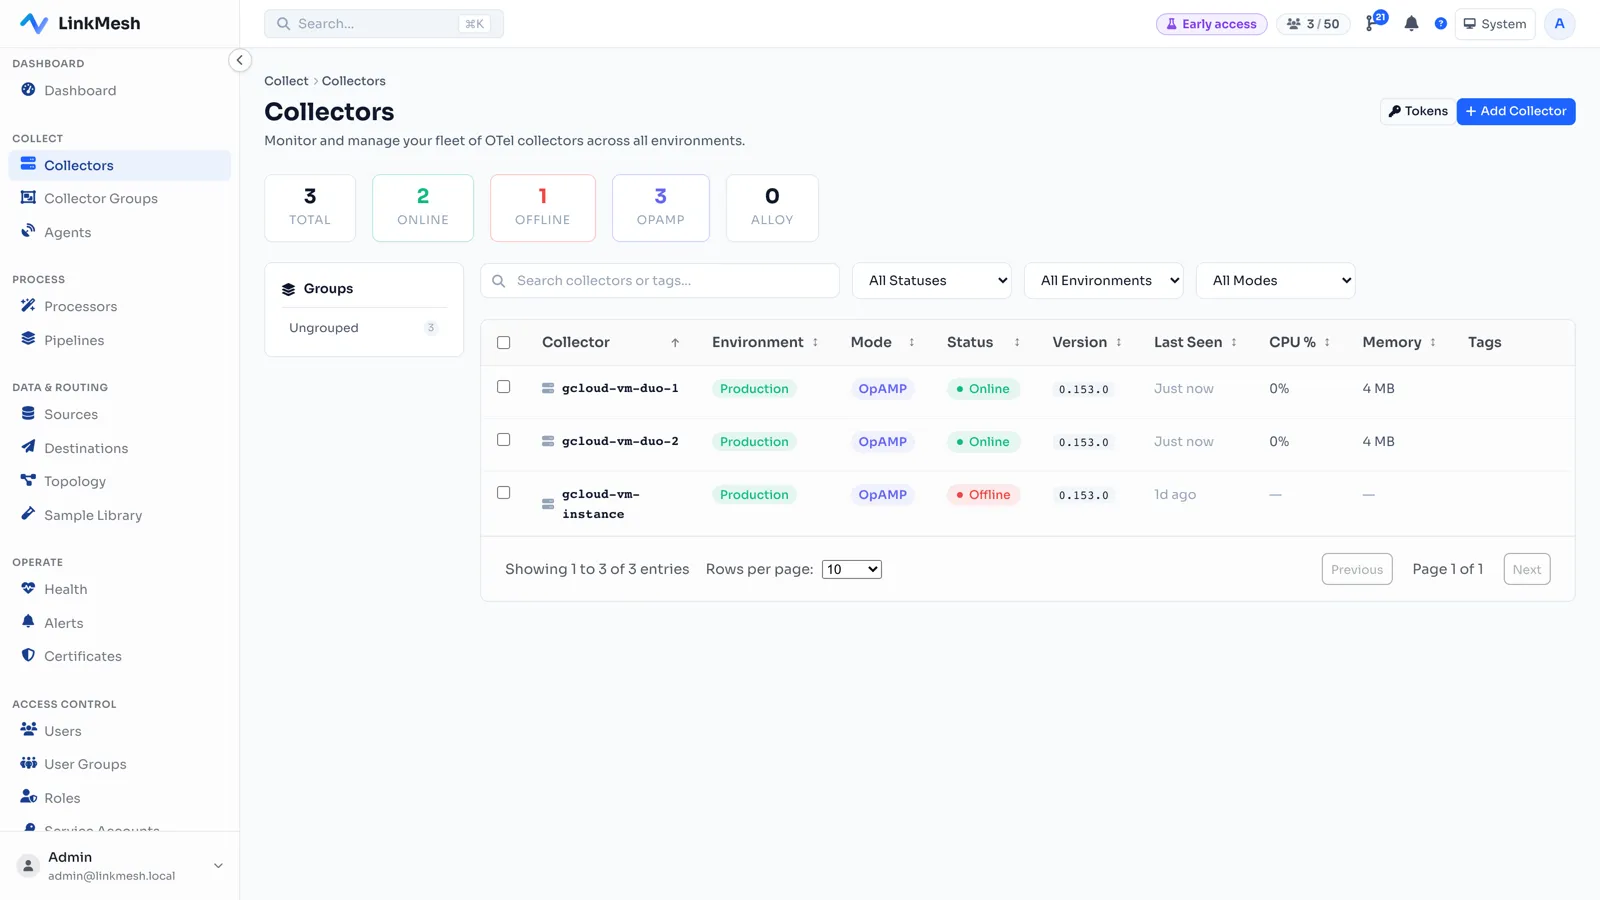
From there LinkMesh fills exactly the gaps the protocol leaves open:
- Config authoring + validation in a visual builder — you compose sources, processors, routes, and destinations, and LinkMesh renders and validates the Collector config before pushing it over OpAMP.
- Push + apply status — you can see a config land and take effect on each host, with per-collector apply history rather than hoping a playbook converged.
- Health + effective-config reporting feeds a live fleet view, and comparing the requested config against the reported effective config surfaces drift.
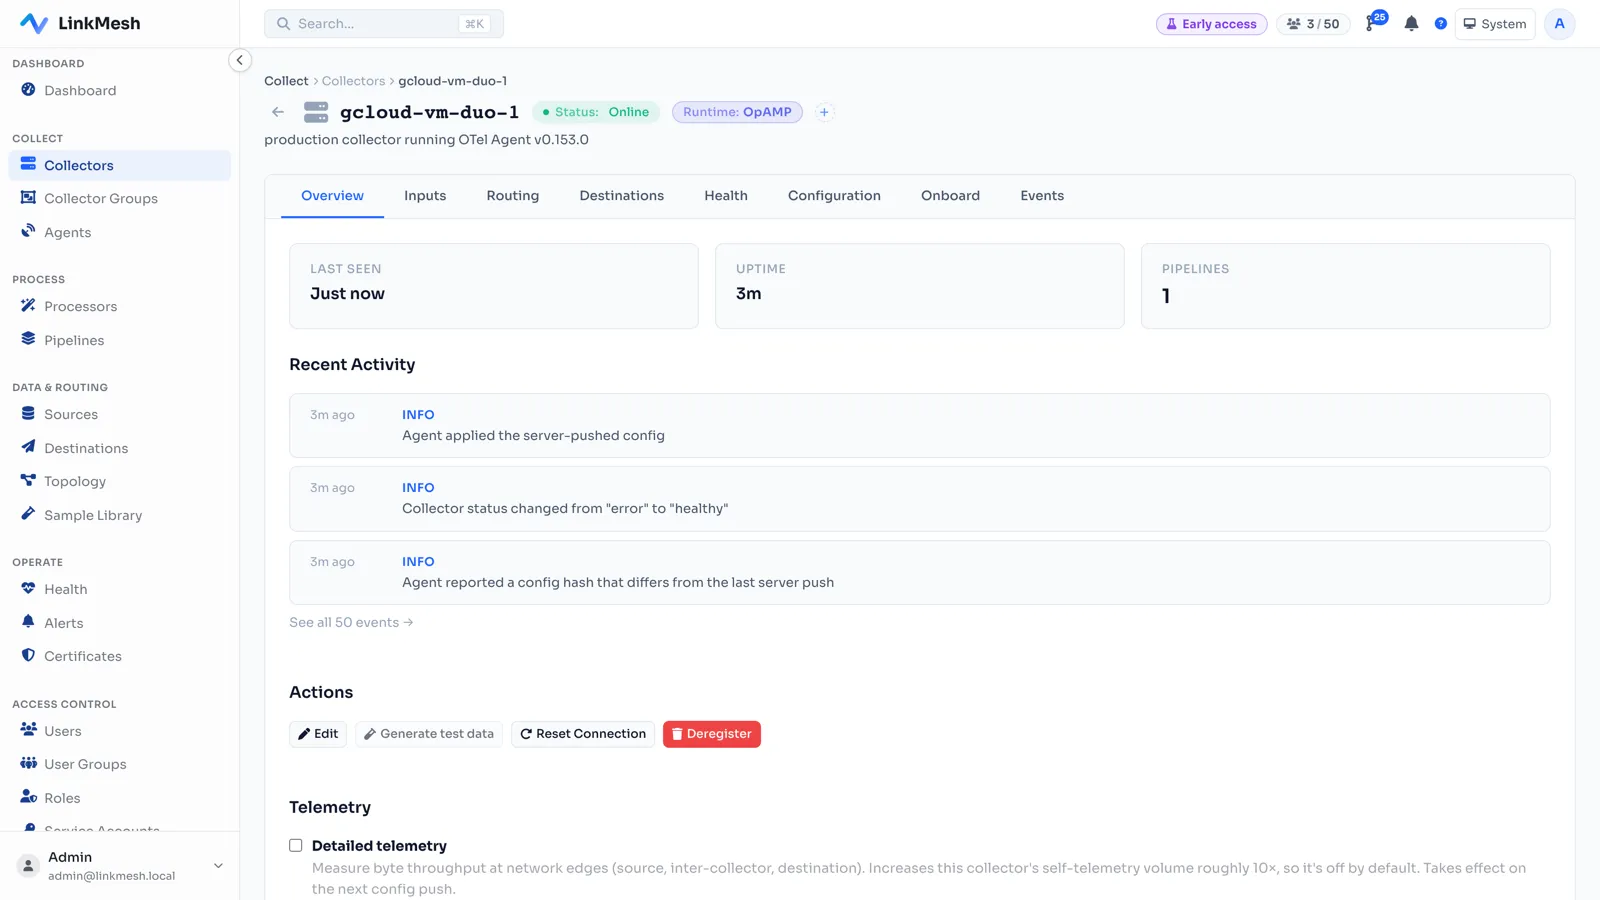
Your telemetry never flows through LinkMesh — only OpAMP management traffic (status up, config down) does. The collectors stay on your infrastructure; the control plane just manages them.
If OpAMP is the standard for how to manage an OTel fleet, a control plane is what turns that standard into an operable product. You can read more on the Features page, see the concepts behind pipelines in our telemetry pipeline guide, or stand one up and enroll your first collector in a few minutes at linkmesh.io/install.