
 LinkMeshObservability Data Collection Management
Sampling Governance
Consistent, safe, cost-effective sampling across the fleet.
 Roman Hüsler← Back to blog
Sampling is the most powerful cost lever in a telemetry pipeline, and the one most likely to blow up in your face. Drop 90% of your traces and your bill falls by nearly that much — but drop the wrong 90% and you have blinded yourself to the exact incidents you keep telemetry to catch. The lever is real; the danger is that it’s usually pulled by whoever felt cost pressure that quarter, in whatever service they happened to own, with no coordination across the rest of the fleet.
That is the difference between doing sampling and governing sampling. This guide is about the second: making sampling consistent across a whole Collector fleet, safe by default, and set centrally so no one silently changes the fidelity everyone else depends on. We’ll cover tail sampling versus head sampling, the golden rule that keeps sampling from hiding your incidents, why consistency across services is non-negotiable, and how to govern the rates instead of leaving them to chance.
Platform leads, SREs, and observability owners responsible for telemetry across many services and teams — anyone weighing a trace bill against the fear of missing the trace that explains the next outage. Prerequisites: a fleet of OpenTelemetry Collectors and the authority to standardize how sampling is configured across it.
Head vs tail sampling: the core trade-off
There are two moments you can decide whether to keep a trace, and they behave very differently.
Head sampling decides at ingest, before the trace is complete, usually on a fixed
probability. The Collector’s probabilistic_sampler is the workhorse:
processors:
  probabilistic_sampler:
    sampling_percentage: 15
That keeps 15% of the flow and drops the rest, cheaply and statelessly — no buffering, no memory of the trace. The catch: because it decides before it knows how the trace turned out, it can’t preferentially keep the interesting ones. An error trace has the same 15% chance of survival as a boring success. It’s fast and predictable but blind to outcome.
Tail sampling waits until the trace is (mostly) complete, then decides based on
what actually happened — keep it if any span errored, if latency crossed a threshold,
if it touched a sensitive service. The tail_sampling processor holds spans in memory
until it can judge the whole trace:
processors:
  tail_sampling:
    decision_wait: 10s
    policies:
      - name: keep-errors
        type: status_code
        status_code: { status_codes: [ERROR] }
      - name: keep-slow
        type: latency
        latency: { threshold_ms: 1000 }
      - name: sample-the-rest
        type: probabilistic
        probabilistic: { sampling_percentage: 10 }
Tail sampling is far smarter but costs more to run: it buffers spans for the
decision_wait window, needs memory proportional to in-flight traces, and — critically
— requires that all spans of a trace reach the same Collector instance, which
constrains how you deploy (typically a tail-sampling tier with trace-ID-aware load
balancing in front). Head sampling has none of those requirements. Most mature fleets
use both: cheap head sampling to shed obvious bulk, a tail-sampling tier to make the
smart keep/drop calls on what remains.
The golden rule: never sample away your errors
Whichever mechanism you use, one rule governs all of it: keep 100% of the traces you actually need, and sample only the boring happy path. Concretely, always keep:
- Errors — anything with a non-OK status. These are the traces you open during an incident; sampling them is sampling away your debugging.
- Slow traces — anything past a latency threshold, because tail latency is where the interesting problems live.
- Security- and compliance-relevant traces — auth flows, payment paths, anything you may need to reconstruct for an audit or investigation.
Only after those are unconditionally kept do you sample the high-volume, successful, unremarkable majority — which is where nearly all your volume is anyway. This is exactly what the tail-sampling policy above encodes: explicit keep rules for errors and slow traces first, a probabilistic policy for everything that falls through. Over-sample this the wrong way and you don’t just lose data, you lose it precisely when it matters, which is the failure mode that makes people distrust sampling entirely.
Consistency: a trace kept half the time is a trace lost
Here is the subtle failure that bites distributed sampling. A single trace crosses many services. If each service independently flips a coin at 15%, the odds that every hop keeps its span are vanishingly small — you end up with traces that are present in service A, missing in service B, present again in C. A partially-sampled trace is often worse than no trace: it looks complete, but the gap is exactly where you needed to look.
The fix is consistent, deterministic sampling keyed on the trace ID. Instead of an
independent coin flip per service, every Collector hashes the trace ID and applies the
same threshold, so a given trace is either kept everywhere or dropped everywhere. The
probabilistic_sampler does this when configured for trace-ID-based consistent
sampling, and the ecosystem is standardizing on consistent probability sampling (the
W3C trace-context tracestate carries the sampling threshold so downstream samplers
agree). The practical requirement: every Collector in the path must use the same hash
and the same rate. Two services sampling at different percentages, or with different
salts, reintroduces the holes you were trying to close. Consistency across the fleet is
not a nicety — it’s what makes a sampled trace usable at all.
Govern the rate centrally, not per team
Now put those two facts together — sampling must keep errors, and it must be consistent across every service — and the operating-model conclusion is unavoidable: sample rates cannot be a per-team setting. If team A samples their service at 5% and team B at 50%, traces that cross both are inconsistent by construction, and nobody has a fleet-wide view of what fidelity actually survives. Worse, a team quietly dialing their rate down to trim their own cost silently degrades everyone whose traces pass through their service — a decision with fleet-wide blast radius made in one repo’s config.
Central governance means the sampling policy — the keep-errors rules, the base rate, the trace-ID keying — is defined once and applied uniformly, so:
- Fidelity is a known quantity. You can answer “what fraction of successful traces are we keeping, everywhere?” with a number, not a shrug.
- No silent fidelity changes. Nobody drops the rate on a critical path without the change being visible, reviewed, and versioned.
- Cost and safety are tuned together. The rate is the cost lever and the visibility lever; owning it centrally is the only way to balance them deliberately rather than reactively.
This is the same argument as governance enforcement in general: a policy that depends on every team remembering to configure it the same way isn’t governed, it’s hoped-for. Sampling just makes the stakes unusually concrete.
Preview before you cut
Sampling changes are scary precisely because the thing you’re removing is invisible until you need it. Two safeguards help. For filter-based drop rules — the explicit “drop debug logs”, “drop health checks” kind — preview the rule’s effect on a captured sample before it ships, and see exactly which records survive. For the sampling policy itself, the safeguard is process: compose it centrally, validate it, version it, and roll it out as one reviewed change rather than a per-team edit.
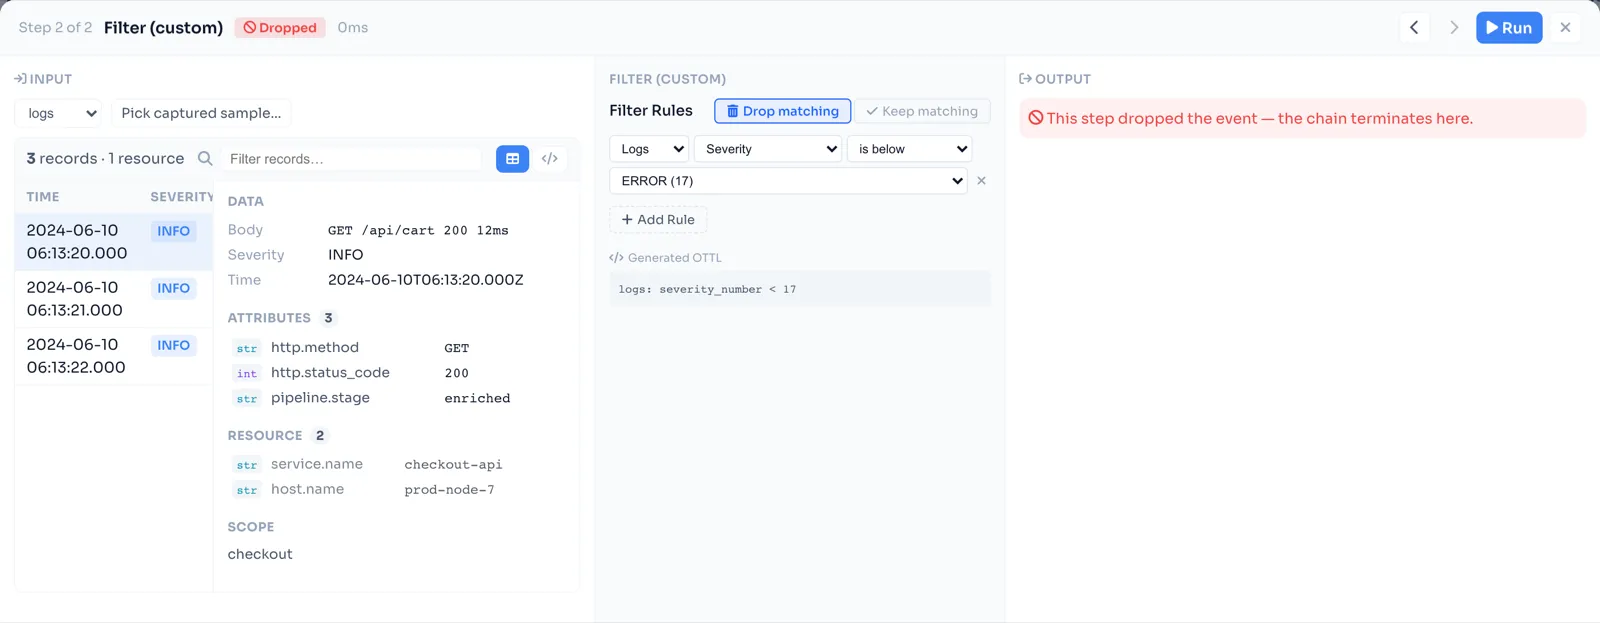
That’s the model LinkMesh is built for: you compose the sampling policy once, preview your filter drop rules on real captured records, and deliver the config to the fleet so every Collector applies the same rate and the same keep rules — consistent by construction, versioned, and auditable. Because the rate lives in one governed config rather than a dozen team repos, changing fidelity is a deliberate, visible act, and the cost savings land without anyone going quietly blind. (For where sampling sits among filtering and routing, see what a telemetry pipeline is.)
Where to start
- Set the golden rule first. Before touching any rate, add explicit keep policies for errors, slow traces, and security-relevant paths so nothing important is ever eligible for dropping.
- Head-sample the obvious bulk. Apply consistent, trace-ID-keyed probabilistic sampling to your highest-volume, lowest-value successful traffic.
- Add a tail-sampling tier when you need outcome-aware decisions, accepting the buffering and trace-affinity constraints it brings.
- Move the rate into central config so it’s one governed number, applied uniformly, changed visibly — never a per-team dial.
Sampling done casually is how teams either overpay or go blind. Sampling governed — errors always kept, consistency guaranteed, rates owned centrally — is how you get the cost cut and keep the trace that explains the outage. The mechanisms are in the Collector; the discipline is in who gets to change the rate.
LinkMesh lets you compose one sampling policy — errors always kept, consistent trace-ID keying, a single governed rate — preview your filter drop rules on real records, and deliver it to the fleet (OpAMP push or remotecfg pull) so every Collector agrees. Versioned, audited, priced per collector. Stand one up in minutes, or see what it does.