
 LinkMeshObservability Data Collection Management
What Is a Telemetry Pipeline?
Cost, routing & PII — and how to run one yourself.
 Philippe Braxmeier← Back to blog
If you run more than a couple of services, your logs, metrics, and traces are already flowing somewhere — usually straight from each host into whatever observability vendor you signed up with. That direct wire works right up until it doesn’t: the bill climbs faster than your traffic, sensitive fields end up in a third party’s index, and switching backends means touching every agent you own.
A telemetry pipeline is the layer that fixes all three problems at once. This guide explains what a telemetry pipeline actually is, the problems it solves, the parts it’s made of, and the options for running one yourself.
- A telemetry pipeline is the layer between the systems that emit logs, metrics and traces and the backends that store them. It filters, samples, redacts and routes telemetry before it leaves your network.
- It runs inside your collectors. A control plane configures those collectors, and it is not the same thing as the pipeline.
- When you compare telemetry pipeline tools, the questions that matter are where the data is processed, what the bill scales with, and how config changes reach the fleet.
What is a telemetry pipeline?
A telemetry pipeline is the processing layer that sits between the systems producing telemetry and the backends that store and analyze it. Instead of every application shipping its logs, metrics, and traces directly to a vendor, the data flows through a pipeline you control first — where it can be filtered, reshaped, enriched, redacted, and routed before it ever leaves your network.
You’ll also see it called an observability pipeline or a telemetry data pipeline. The names are interchangeable; the idea is the same. It’s the same architectural move databases made decades ago: put a layer in the middle so the producers and consumers don’t have to know about each other, and so you have one place to enforce policy.
The key word is control. Without a pipeline, your telemetry’s shape, volume, and destination are decided at the edge, by whatever each service happens to emit. With one, those decisions move to a single, versioned place.
Telemetry pipeline vs. collector vs. control plane
These three terms get used interchangeably. They name different things, and the difference decides where your data flows.
- The pipeline is the logic: which telemetry comes in, what happens to it, and where it goes. Receive, process, export.
- The collector is the runtime that executes that logic. It is a process on a host, a sidecar or a gateway. The OpenTelemetry Collector and Grafana Alloy are the common ones. A fleet of collectors, each running its piece of the pipeline, is what a telemetry pipeline physically is.
- The control plane is the management layer above the collectors. It authors and versions the pipeline config, assigns it to the right collectors, and reports back which ones are healthy and on which version.
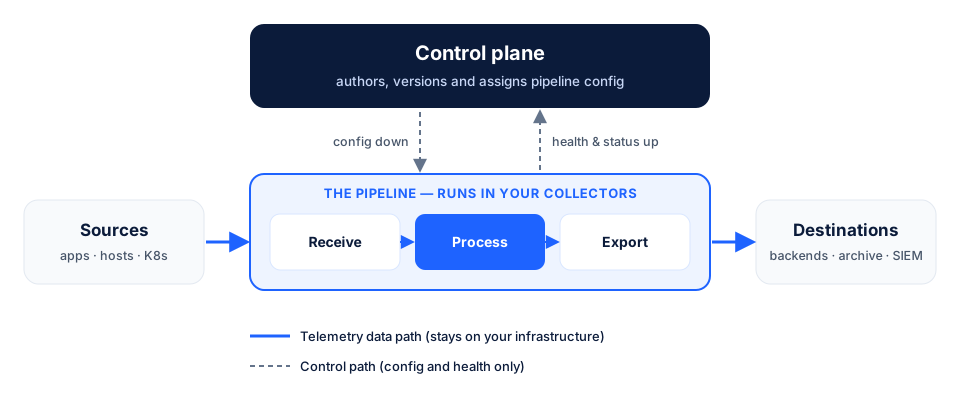
The split matters for one practical reason. Telemetry only has to travel the data path: sources, collectors, destinations. The control path carries config and health, nothing else. A design that keeps those two apart can centralise management without centralising your data. We come back to that below, when we compare the ways to run one.
What problems does a telemetry pipeline solve?
Four recurring problems push teams toward a pipeline:
- Cost control. Observability vendors bill by ingest volume, and most of that volume is noise — debug logs, health-check spans, high-cardinality metrics nobody queries. A pipeline lets you drop, sample, and aggregate that noise before it reaches a per-gigabyte backend, so you pay to store signal, not chatter.
- Vendor lock-in. When every agent points straight at one vendor, migrating is a fleet-wide rewrite. A pipeline decouples producers from destinations: change one routing rule and the same telemetry goes somewhere new, with nothing to touch on the hosts.
- Routing to multiple destinations. Real environments are rarely one-backend. You might want traces in one tool, logs split between a cheap archive and a hot index, and a copy of security-relevant events forwarded to a SIEM. A pipeline fans a single stream out to many destinations by rule.
- PII and compliance. Logs leak secrets — emails, tokens, card numbers, IPs. If telemetry ships straight off the host, that data is already gone. A pipeline gives you a checkpoint on your own infrastructure to mask or drop sensitive fields before anything crosses the network boundary.
If any of those sound familiar, you already have a use for a telemetry pipeline — whether or not you’ve named it one yet.
The anatomy of a telemetry pipeline
Every telemetry pipeline, regardless of vendor, is built from the same four stages. Data flows left to right:
Sources are anything that produces telemetry: application SDKs, host agents, Kubernetes workloads, network devices, cloud logs. In an OpenTelemetry-native pipeline these emit over OTLP, the vendor-neutral wire format, though a good pipeline also ingests legacy formats like syslog, Prometheus, and plain log files.
Collectors receive that telemetry and hold it briefly — batching, buffering against backpressure, and retrying on failure so a momentary backend outage doesn’t drop data. The OpenTelemetry Collector and Grafana Alloy are the two common choices.
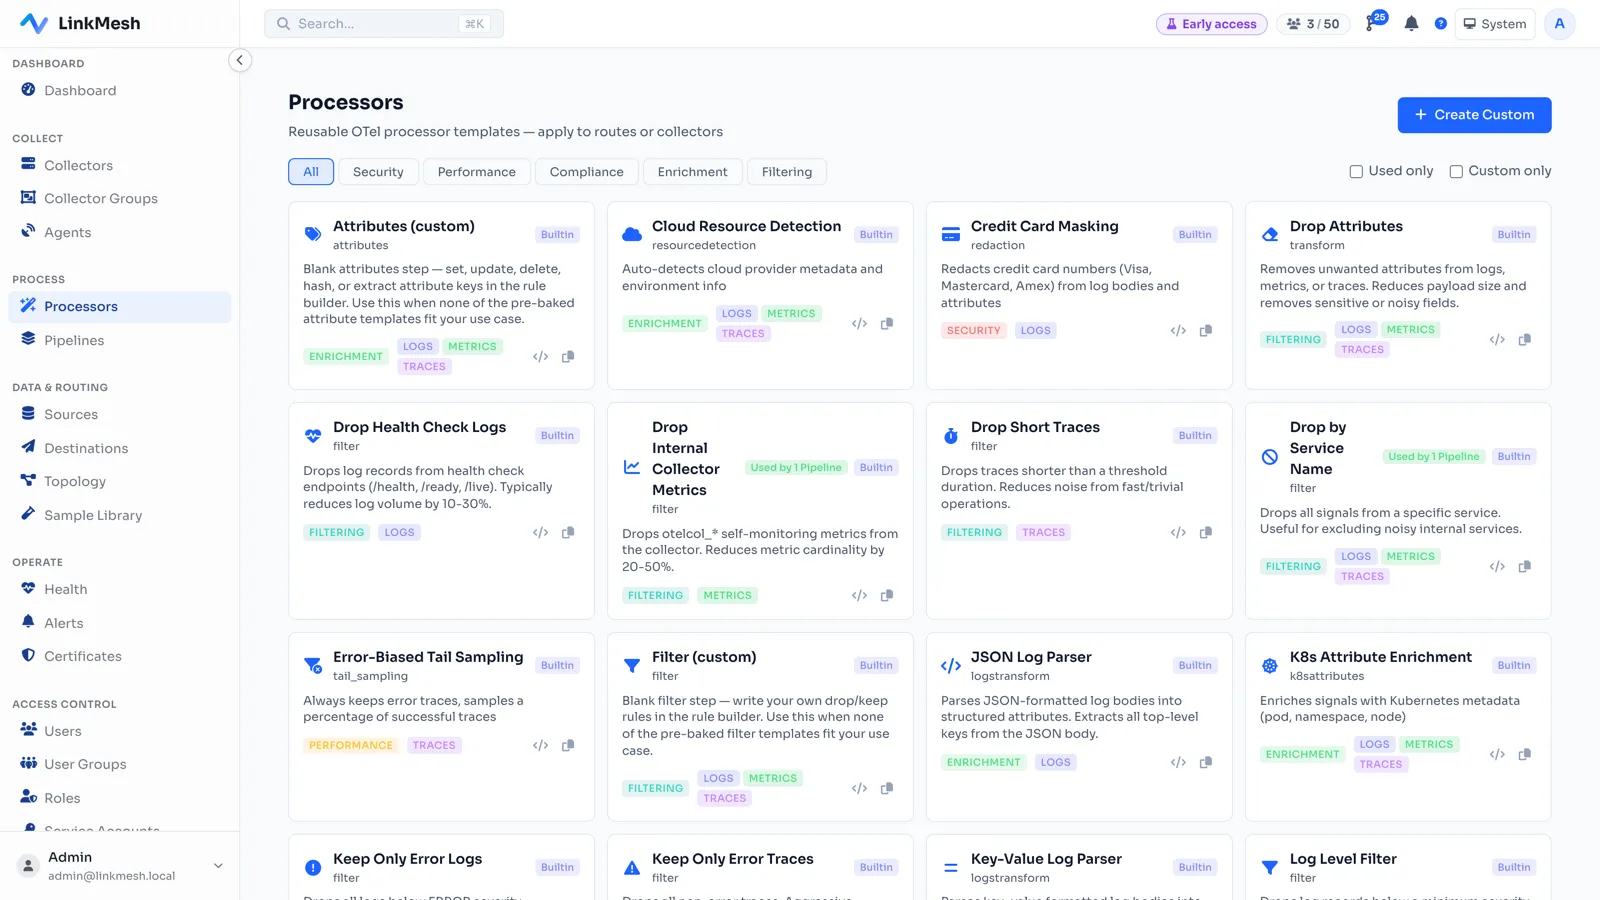
Processors are where the pipeline earns its keep. This is the stage that filters out noise, samples high-volume traces, redacts PII, enriches records with metadata (environment, team, region), and transforms formats. Every cost and compliance decision lives here.
Destinations are the backends the refined telemetry lands in: Grafana Cloud, Loki, Datadog, an object store for cheap archival, a SIEM for security events. One pipeline commonly writes to several, choosing per-destination what each one receives — the mechanic behind that choice is routing by attribute, covered in depth in Route Telemetry by Attribute.
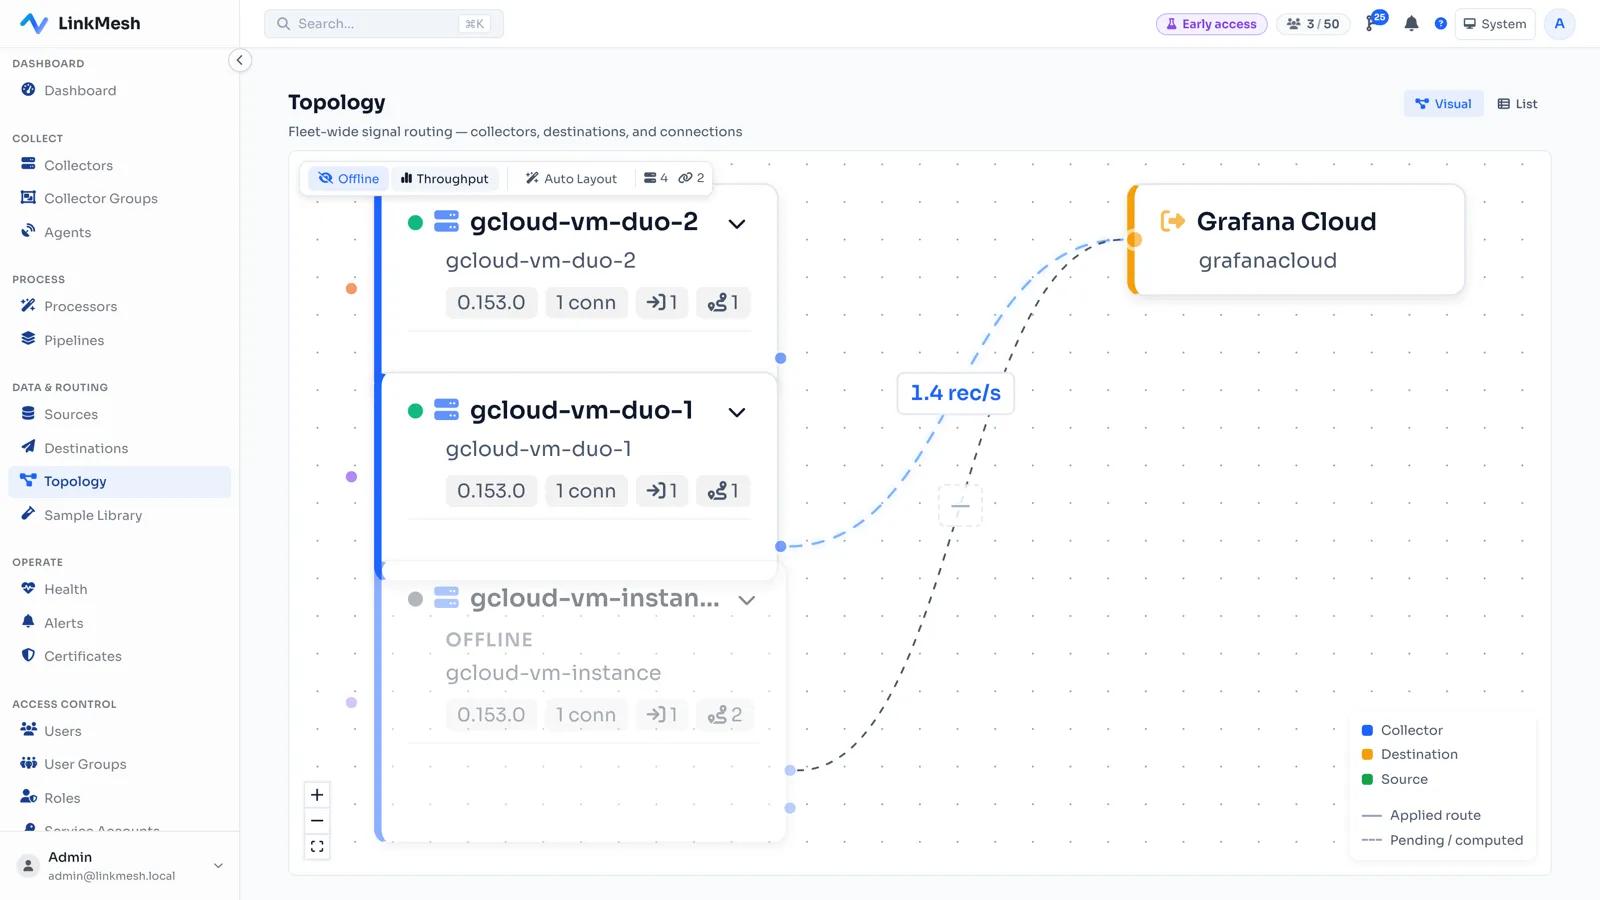
Here’s that same four-stage flow as a live routing canvas — real collectors on the left meshed through to a destination on the right, with throughput shown on each edge:
The processor stage is worth seeing on its own, because it’s where the noise-versus-signal tradeoff actually gets made:
What to look for in telemetry pipeline tools
Whichever product or project you evaluate, the same handful of questions separates a pipeline you can run for years from one you will be migrating off in eighteen months:
- Where is the data processed? On your own infrastructure, or does telemetry transit a vendor’s cloud to be filtered? If the point of the pipeline is to redact PII before it leaves your network, processing has to happen before it leaves.
- What does the bill scale with? Per-gigabyte pricing on the pipeline itself means every byte you manage to drop still gets charged once. Pricing per node or per collector does not punish you for reducing volume.
- Is it OpenTelemetry-native in and out? OTLP on both sides keeps sources and backends swappable. A proprietary agent or wire format recreates the lock-in the pipeline was supposed to remove.
- How do config changes reach the fleet? Look for versioned config, a staged rollout and a one-step rollback, plus a view of which collector runs which version. Hand-editing YAML per host does not scale past a handful of collectors.
- Can you see what a processor will do before it ships? A filter or redaction rule tested against real records catches the rule that drops the wrong data before it drops it everywhere.
- Can you route by attribute to more than one destination? Traces to one backend, logs split between a hot index and a cheap archive, security events to a SIEM, all from one stream.
None of these is exotic. Together they are the difference between a pipeline and a second copy of the problem it was meant to solve.
Build vs. SaaS vs. self-hosted control plane
Once you’ve decided you want a telemetry pipeline, there are three ways to get one.
Build it yourself. You can hand-roll a pipeline out of raw OpenTelemetry Collectors and config files. It’s free and fully under your control, but every collector becomes an island: its own config, its own version, its own way of drifting out of line. Managing more than a handful by hand — answering “which collectors are on last week’s config?” — turns into an ops burden of its own.
Buy a SaaS pipeline. Managed observability-pipeline vendors handle the control plane for you, but your telemetry usually flows through their infrastructure to get processed. For data that carries PII, that’s the exact problem you were trying to avoid — plus pricing that often scales with the volume you’re trying to reduce.
Run a self-hosted control plane. The middle path: a control plane you host yourself that manages your collector fleet from one place — pushing config, reporting health, and showing throughput — while the telemetry itself never leaves your network. You get the central management of SaaS without handing your data (or an open-ended bill) to a third party.
Which is right depends on scale and data sensitivity. A three-collector setup might be fine hand-built; a regulated fleet of hundreds usually is not.
Where LinkMesh fits
LinkMesh is a self-hosted control plane for exactly this. You point any collector — otelcol-contrib via OpAMP, or Grafana Alloy via remotecfg — at LinkMesh with one config block and a token. From there you compose sources, processors, routes, and destinations once in the UI, and LinkMesh renders the collector config, validates it, and pushes it to the right collectors. Your telemetry stays on your own infrastructure the entire time; only config and health metrics flow to the control plane.
That means you get the four stages above as things you edit, not YAML you hand-maintain per host — with per-edge throughput so you can see where volume enters and where a route sheds it, before the bill tells you. Pricing is per managed collector, not per gigabyte, so shaping your data down doesn’t cost you money to do.
If you want the concepts in more depth, the Features page walks through what the control plane does, and you can stand one up and enroll your first collector in a few minutes from linkmesh.io/install.
Go deeper
Each stage of a telemetry pipeline has its own guide on this blog:
- Why the layer exists at all: The missing layer in observability
- Routing: Route telemetry by attribute
- Cost and volume: Observability cost starts at the edge and tail sampling and sampling governance
- Managing the collector fleet: OpenTelemetry collector fleet management and OpAMP explained
- When data goes missing: Debugging telemetry pipelines with live data capture