
 LinkMeshObservability Data Collection Management
OTel Architecture for Enterprises
Agents, gateways, and a control plane — the pattern that scales.
 Philippe Braxmeier← Back to blog
A single OpenTelemetry Collector is easy. One binary, one YAML file, receivers on the left, exporters on the right. It works on your laptop and it works on one host. Then you have three thousand hosts, forty teams, five backends, a compliance rule about PII, and a finance team asking why the ingest bill doubled — and the single-collector mental model stops helping.
At that scale, OpenTelemetry has a reference architecture, and it’s worth knowing before you improvise your own. It has three moving parts: agent collectors close to the workload, a gateway tier in the middle, and a control plane that configures both. This guide walks each part, the data flow between them, where processing belongs, and the security boundaries that keep your telemetry yours.
Platform engineers, SREs, and architects designing an OpenTelemetry deployment that has to survive real scale — many hosts, many teams, multiple backends, and a security or compliance boundary. Prerequisites: you understand what a Collector receiver, processor, and exporter do; here we assemble them into a topology rather than a single config.
The two collector roles
The core insight of the reference architecture is that a Collector plays one of two roles depending on where it sits, and the two roles want different things:
- Agent collectors run close to the telemetry — as a DaemonSet on every
Kubernetes node, or a process on every VM. Their job is local collection: scrape
hostmetrics, tailfilelog, readjournald, receive OTLP from the app on localhost. They’re numerous, they’re resource-constrained (they share the host with your actual workload), and they should stay cheap. - Gateway collectors run as a central, standalone tier — a horizontally-scaled deployment that every agent ships to. They’re few, they’re independently scalable, and they’re where you do the expensive, fleet-wide work: aggregation, tail sampling, heavy redaction, routing to multiple backends.
You can run OTel with agents only, gateways only, or — the pattern most enterprises land on — both. The deployment mechanics of each (DaemonSet, sidecar, gateway) are their own topic; see collector deployment patterns for the how. This post is about why the two-tier shape exists and how the pieces relate.
Why two tiers instead of one
If an agent on every host can export straight to your backend, why add a gateway in the middle? Four reasons, each of which becomes more compelling as you scale:
- Aggregation and tail sampling need a choke point. A trace’s spans arrive at different agents on different hosts. Tail-based sampling — keep the slow traces, the errors, a sample of the rest — needs to see the whole trace, which means the spans have to converge somewhere. That somewhere is the gateway.
- Egress control. You don’t want three thousand hosts each opening a connection to a third-party backend across your network boundary. Funnel through a gateway tier and egress happens from a small, known set of nodes you can firewall, monitor, and rotate credentials on.
- Backend fan-out belongs in one place. Routing the same stream to two backends, or splitting logs to cheap storage and traces to your APM vendor, is config you want to change once at the gateway, not push to every agent.
- Agents stay light. Keeping heavy processing off the hosts means the agent’s CPU and memory footprint stays small and predictable, which matters when it’s sharing a node with the workload you actually care about.
The trade-off is honest: the gateway tier is infrastructure you now have to run, scale, and keep highly available. It’s a component that can fail, and if it does, it sits between your telemetry and your backend. That’s a real cost — covered in collector high availability — and it’s the price of the leverage the tier gives you.
The data flow
End to end, telemetry moves through the architecture in one direction:
sources → agent tier → gateway tier → backends.
Sources are your hosts, pods, and instrumented applications. Agents collect locally and do light, cheap work — set resource attributes, drop obvious noise — then forward over OTLP to the gateway. The gateway does the expensive, stateful work — aggregate, tail sample, redact, route — and exports to one or more backends. Above all of it, a control plane configures every collector in both tiers without the telemetry ever passing through it.
Where processing belongs: edge vs gateway
The recurring design question is where to run each processor — on the agents at the edge, or centrally at the gateway. The answer isn’t “always one place”; it depends on what the processor needs.
Do at the edge (agent):
- Resource attribution. Set
service.name,deployment.environment.name, andk8sattributeswhere the context is — on the node that knows which pod produced the data. Do it late and you’ve lost the local context. - Obvious, cheap noise drops. Dropping health-check spam or sub-INFO logs early means you never pay to ship them to the gateway.
- Redaction of the most sensitive fields, when your boundary requires PII to be masked before it leaves the host — more on this below.
Do at the gateway:
- Tail-based sampling. It needs the whole trace assembled, which only happens once spans converge. It can’t work at the edge.
- Cross-stream aggregation and anything stateful that benefits from seeing traffic from many hosts at once.
- Heavy or CPU-expensive transforms, kept off the shared workload hosts.
- Backend routing and fan-out, so a destination change is one edit in one tier.
# Agent: light, local, cheap — set context and forward
receivers:
  filelog: { include: [/var/log/pods/*/*/*.log] }
processors:
  resourcedetection: { detectors: [env, system] }
  k8sattributes:
  filter/drop_health: { logs: { log_record: ['IsMatch(attributes["url.path"], "/healthz")'] } }
exporters:
  otlp/gateway: { endpoint: "otel-gateway.internal:4317" }
service:
  pipelines:
    logs: { receivers: [filelog], processors: [k8sattributes, resourcedetection, filter/drop_health], exporters: [otlp/gateway] }
# Gateway: expensive, stateful, fleet-wide — sample, redact, route
receivers:
otlp: { protocols: { grpc: { endpoint: "0.0.0.0:4317" } } }
processors:
tail_sampling:
policies:
- name: errors
type: status_code
status_code: { status_codes: [ERROR] }
redaction/pii:
allow_all_keys: true
blocked_values: ['\d{3}-\d{2}-\d{4}']
exporters:
otlphttp/primary: { endpoint: "https://backend-a.internal:4318" }
otlphttp/archive: { endpoint: "https://backend-b.internal:4318" }
service:
pipelines:
traces: { receivers: [otlp], processors: [tail_sampling, redaction/pii], exporters: [otlphttp/primary, otlphttp/archive] }The trade-off to name: edge redaction is safer (sensitive data never leaves the host) but costs CPU on every node and is harder to keep consistent across a large fleet. Gateway redaction is easier to enforce uniformly but means the raw data crosses your internal network to reach the gateway. Which you pick is a boundary decision, not a default — see sampling governance and PII masking in logs for the specifics.
The control plane: OpAMP
Draw the agent and gateway tiers and you’ve drawn the data plane. The missing piece is the control plane: the thing that decides what config each of those collectors runs, and keeps it current. In the OpenTelemetry ecosystem that’s OpAMP — the Open Agent Management Protocol — a standard for a central server to own each collector’s configuration and push updates to the fleet.
This matters at enterprise scale for one blunt reason: hand-editing YAML on three thousand nodes is not an operating model. Without a control plane you get config drift, no audit trail, and no safe way to preview a change before it hits production. With one, the fleet’s configuration is a single governed artifact — rendered, validated, pushed, and versioned. The critical property is that the control plane manages config, not data: it never sits in the telemetry path.
Security boundaries
The reference architecture is also a security architecture, and its central property is worth stating plainly: your telemetry stays on your infrastructure. It flows sources → agent → gateway → backend, all inside your network, and egress to any external backend happens only from the gateway tier you control.
- Egress is centralized. Only gateways talk to external backends. That’s a small, auditable set of nodes to firewall and to rotate credentials on — not every host.
- PII is redacted before egress. Whatever leaves your boundary has already passed the redaction processors. Where exactly that happens (edge vs gateway) is the trade-off above, but that it happens before egress is the rule.
- The control plane is out of the data path. A control plane like LinkMesh configures the fleet over OpAMP but the telemetry never flows through it — it stays on your infrastructure, moving straight from collectors to your backend. The management layer is not a new place for sensitive data to sit, and not a new external dependency in the hot path.
That last point is the one enterprises should press hardest on when evaluating any management tool: if adopting it means routing your telemetry through a vendor’s cloud, you’ve reintroduced exactly the dependency the architecture exists to remove.
Scaling and HA at the gateway
The gateway tier is where availability engineering concentrates, because it’s the shared
component every agent depends on. The short version: run gateways as a horizontally
scaled, load-balanced deployment; use the collector’s memory_limiter and queued-retry
settings so backpressure doesn’t cascade; and put a load balancer (trace-aware, if
you’re tail sampling) in front so spans of one trace land on the same instance. The
agents, by contrast, scale trivially — one per host — and their failure domain is a
single node.
That’s the sketch; the gateway HA design has enough depth to warrant its own treatment, including load-balancing for tail sampling and what happens during a rollout. It’s in collector high availability, and the safe way to change gateway config without an outage is in config rollout and rollback.
Putting it together
The enterprise OpenTelemetry architecture is three parts and one rule:
- Agents collect locally, do cheap shaping, and forward — numerous and light.
- Gateways aggregate, sample, redact, and route — few and independently scaled.
- A control plane (OpAMP) configures both without touching the data.
- The rule: telemetry stays on your infrastructure; egress is centralized; the management layer never enters the data path.
Get those relationships right and scale becomes a question of adding capacity to a known shape, not reinventing the topology every time the estate grows. The single-collector mental model was never wrong — it just wasn’t the whole picture.
For estates under a sovereignty requirement — Swiss banking, insurance, public sector — the same shape with each tier’s location, classification and egress pinned down is in how to build a Swiss sovereign telemetry architecture.
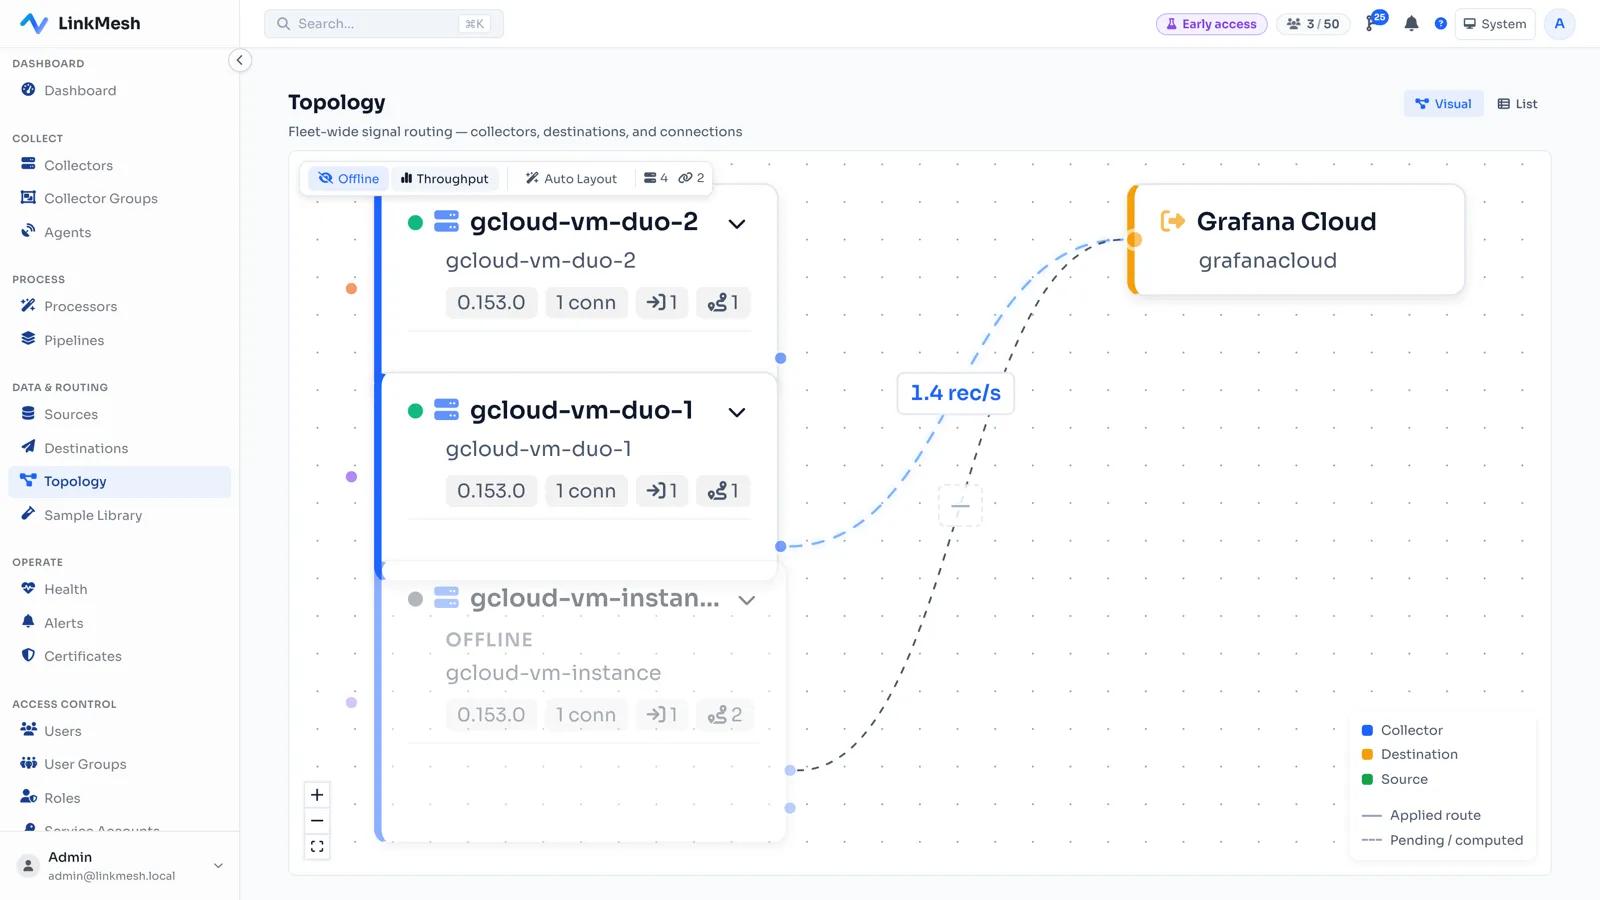
The architecture is three tiers; operating it is a fleet-configuration problem. LinkMesh is a self-hosted OpAMP control plane that composes, validates, and pushes collector config to both your agent and gateway tiers — with per-edge throughput so the data flow is a number you can watch, not a diagram you hope holds. Telemetry stays on your infrastructure; priced per collector, not per GB. Stand one up in minutes, or see what it does.