

 LinkMeshObservability Data Collection Management
Route Telemetry by Attribute
Send the right data to the right backend.
 Roman Hüsler← Back to blog
Not every log line deserves the same backend. Error-level logs and the traces behind an SLO belong somewhere fast and expensive to query. Full-fidelity access logs and audit trails belong somewhere cheap, kept for compliance and rarely opened. Debug noise from a chatty sidecar belongs nowhere at all. Left alone, most fleets fan everything out to one destination anyway — because splitting it by hand means editing OTTL on every collector, keeping the copies in sync, and hoping nobody typos the condition on host 14.
This post is about routing telemetry by attribute: matching on what’s actually in the record — a severity, a namespace, a status code — and sending different matches to different places. We’ll cover how the OpenTelemetry Collector does this natively, how LinkMesh turns the condition into something you build instead of hand-write, and a second, easily confused mechanic — joining a destination to a route by label instead of wiring it in by hand.
What routing by attribute actually means
The OpenTelemetry Collector’s routing connector is the OTel-native mechanic: one
receiver takes everything in, a table of conditions decides which downstream pipeline
each record takes, and anything that matches nothing falls through to a default. We
covered the same connector for splitting traffic by tenant in our
multi-tenant Collector architecture guide
— attribute routing is the same connector, evaluating a different kind of condition:
not “which tenant owns this,” but “which destination does this record’s content earn.”
connectors:
  routing:
    default_pipelines: [logs/fallthrough]
    table:
      - context: log
        condition: severity_number >= SEVERITY_NUMBER_ERROR
        pipelines: [logs/archive]

service:
  pipelines:
    logs/in:
      receivers: [otlp]
      exporters: [routing]
    logs/archive:
      receivers: [routing]
      exporters: [otlphttp/archive]
    logs/fallthrough:
      receivers: [routing]
      exporters: [otlphttp/default]
That’s the whole mechanic: one condition, one match destination, one catch-all. The version LinkMesh renders and pushes to your fleet is richer — more than one condition, evaluated in order — but it’s the same idea: one stream in, conditions checked in priority order, a default catch-all for whatever matches nothing.
Step 1 — Routes evaluate in priority order, first match wins
The important thing to get right mentally, because it’s easy to over-imagine: a route list is not a declarative table where every row gets checked and every match fires. It’s a priority-ordered cascade — the same model Cribl uses. Route 1’s condition is checked first; if it matches, that record goes to Route 1’s destination and evaluation stops. If it doesn’t match, Route 2 is checked, then Route 3, and so on, until something matches or the record falls through to whatever you’ve set as the default.
That ordering is also the safety valve. Put a specific, narrow condition first (route
this one noisy namespace to /dev/null-equivalent storage) and a broad catch-all last,
and you get exactly the override behavior you’d expect — without the ambiguity of “what
happens when two rows both match,” because in a cascade only the first one that matches
ever gets to.
Step 2 — Build the match filter without hand-writing OTTL
Every LinkMesh route carries a match filter compiled to OTTL under the hood, but you
don’t start in a textarea. The route matcher is a field / operator / value picker:
choose the field (a resource attribute, a log attribute, severity, status code, …),
an operator (equals, contains, greater-than, exists, and so on), a value, and LinkMesh
compiles it into the same condition syntax the routing connector evaluates.
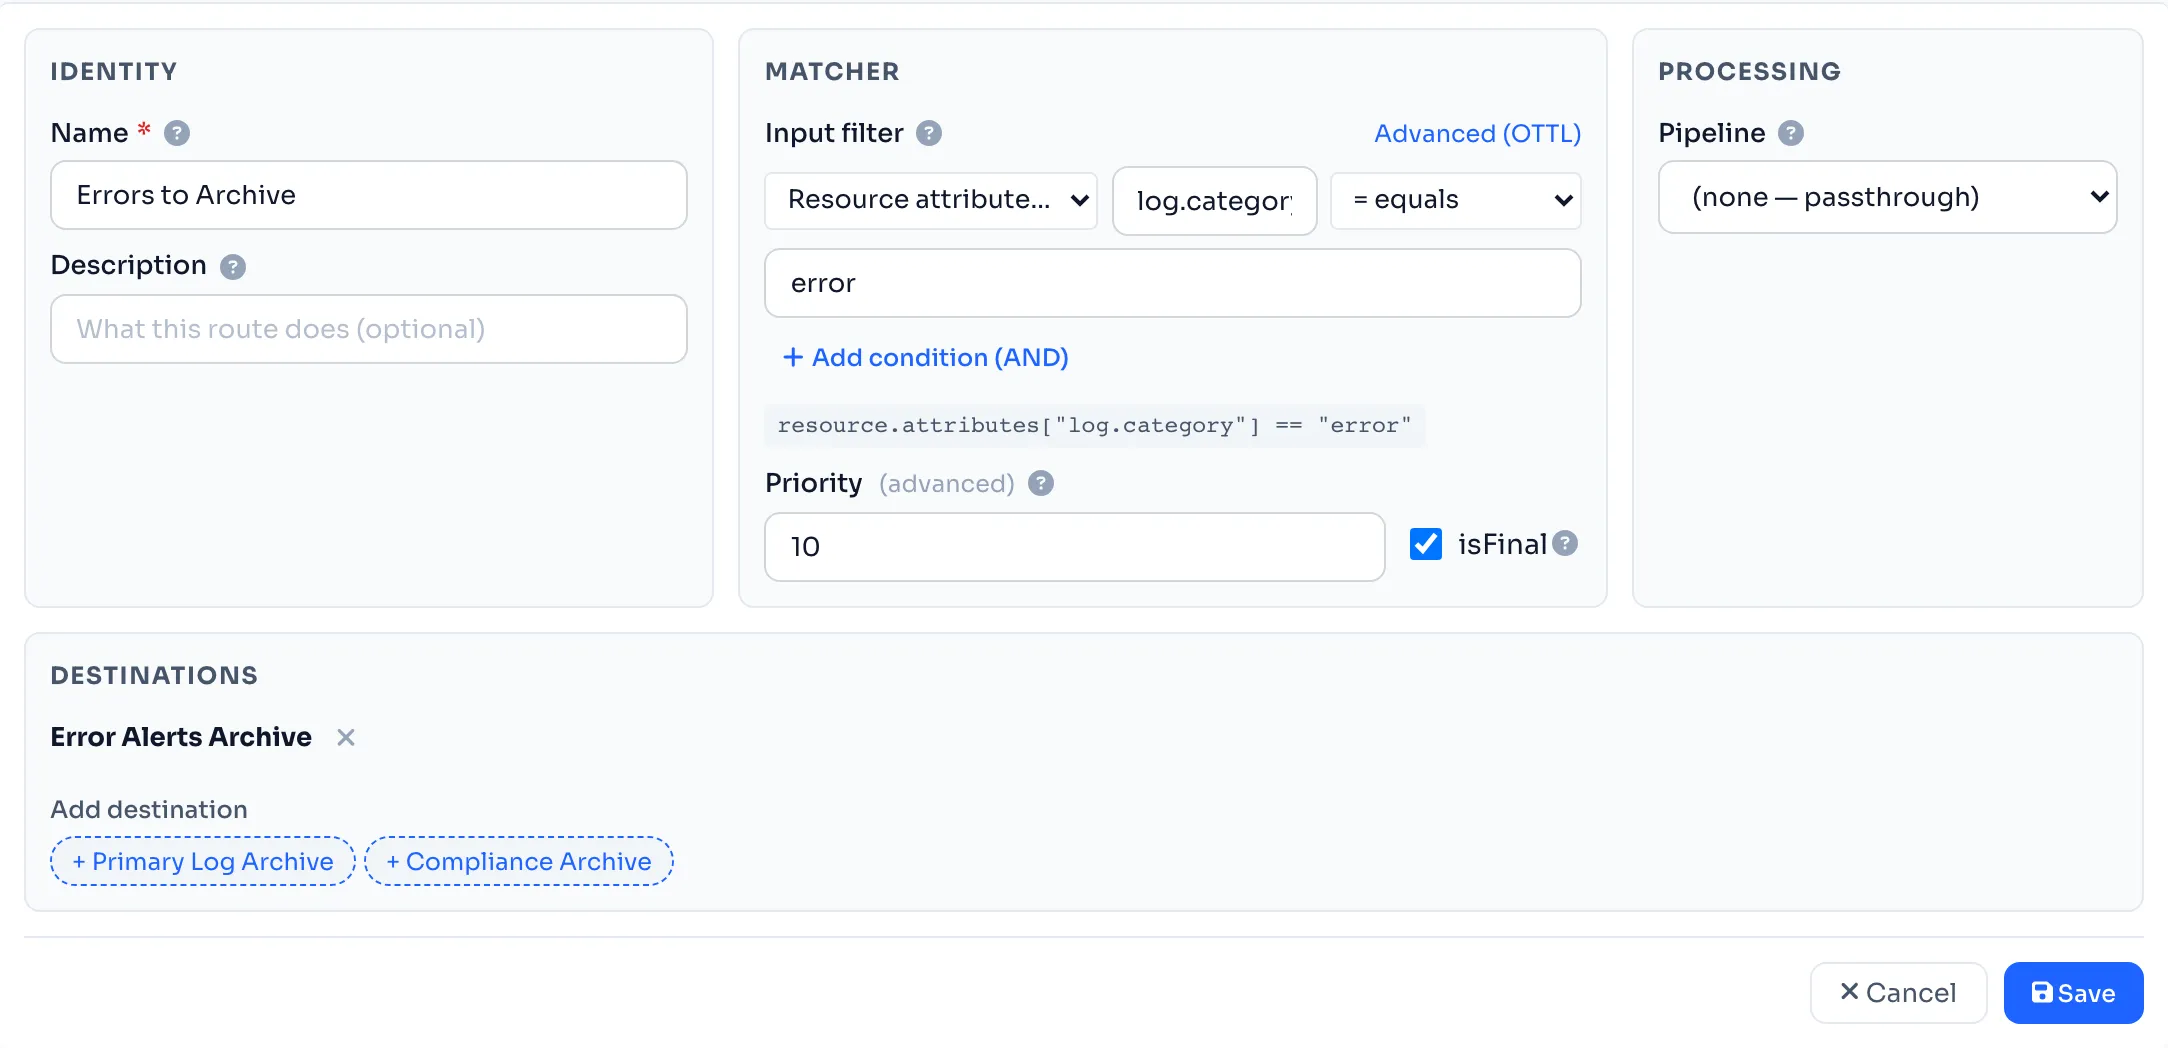
Stacking a couple of fields with AND gets you most of what you need day to day —
severity ≥ ERROR and service.namespace == "checkout", say. For anything past that —
an OR across fields, a regex, a nested boolean expression — the builder has an
Advanced tab that drops to raw OTTL. That’s a deliberate, honest trade-off: the
guided builder covers the common single- and AND-condition case well; it isn’t trying
to be a full visual expression editor, and expressions that need one still go through
Advanced.
Step 3 — Give the route somewhere to go
A route without a destination just evaluates and drops the match on the floor, which is occasionally what you want (a route with no destination doubles as a documented drop rule) but usually isn’t. Point a route at one or more destinations and a match ships there; leave the priority list’s last route as a broad catch-all pointed at your default backend, and nothing goes unrouted by accident.
Step 4 — Verify it with real traffic
Config that looks right and config that behaves right are two different claims, so the last step is watching it work. LinkMesh’s topology canvas shows per-edge throughput — records per second on every branch — so a route split shows up as a number, not a hope:
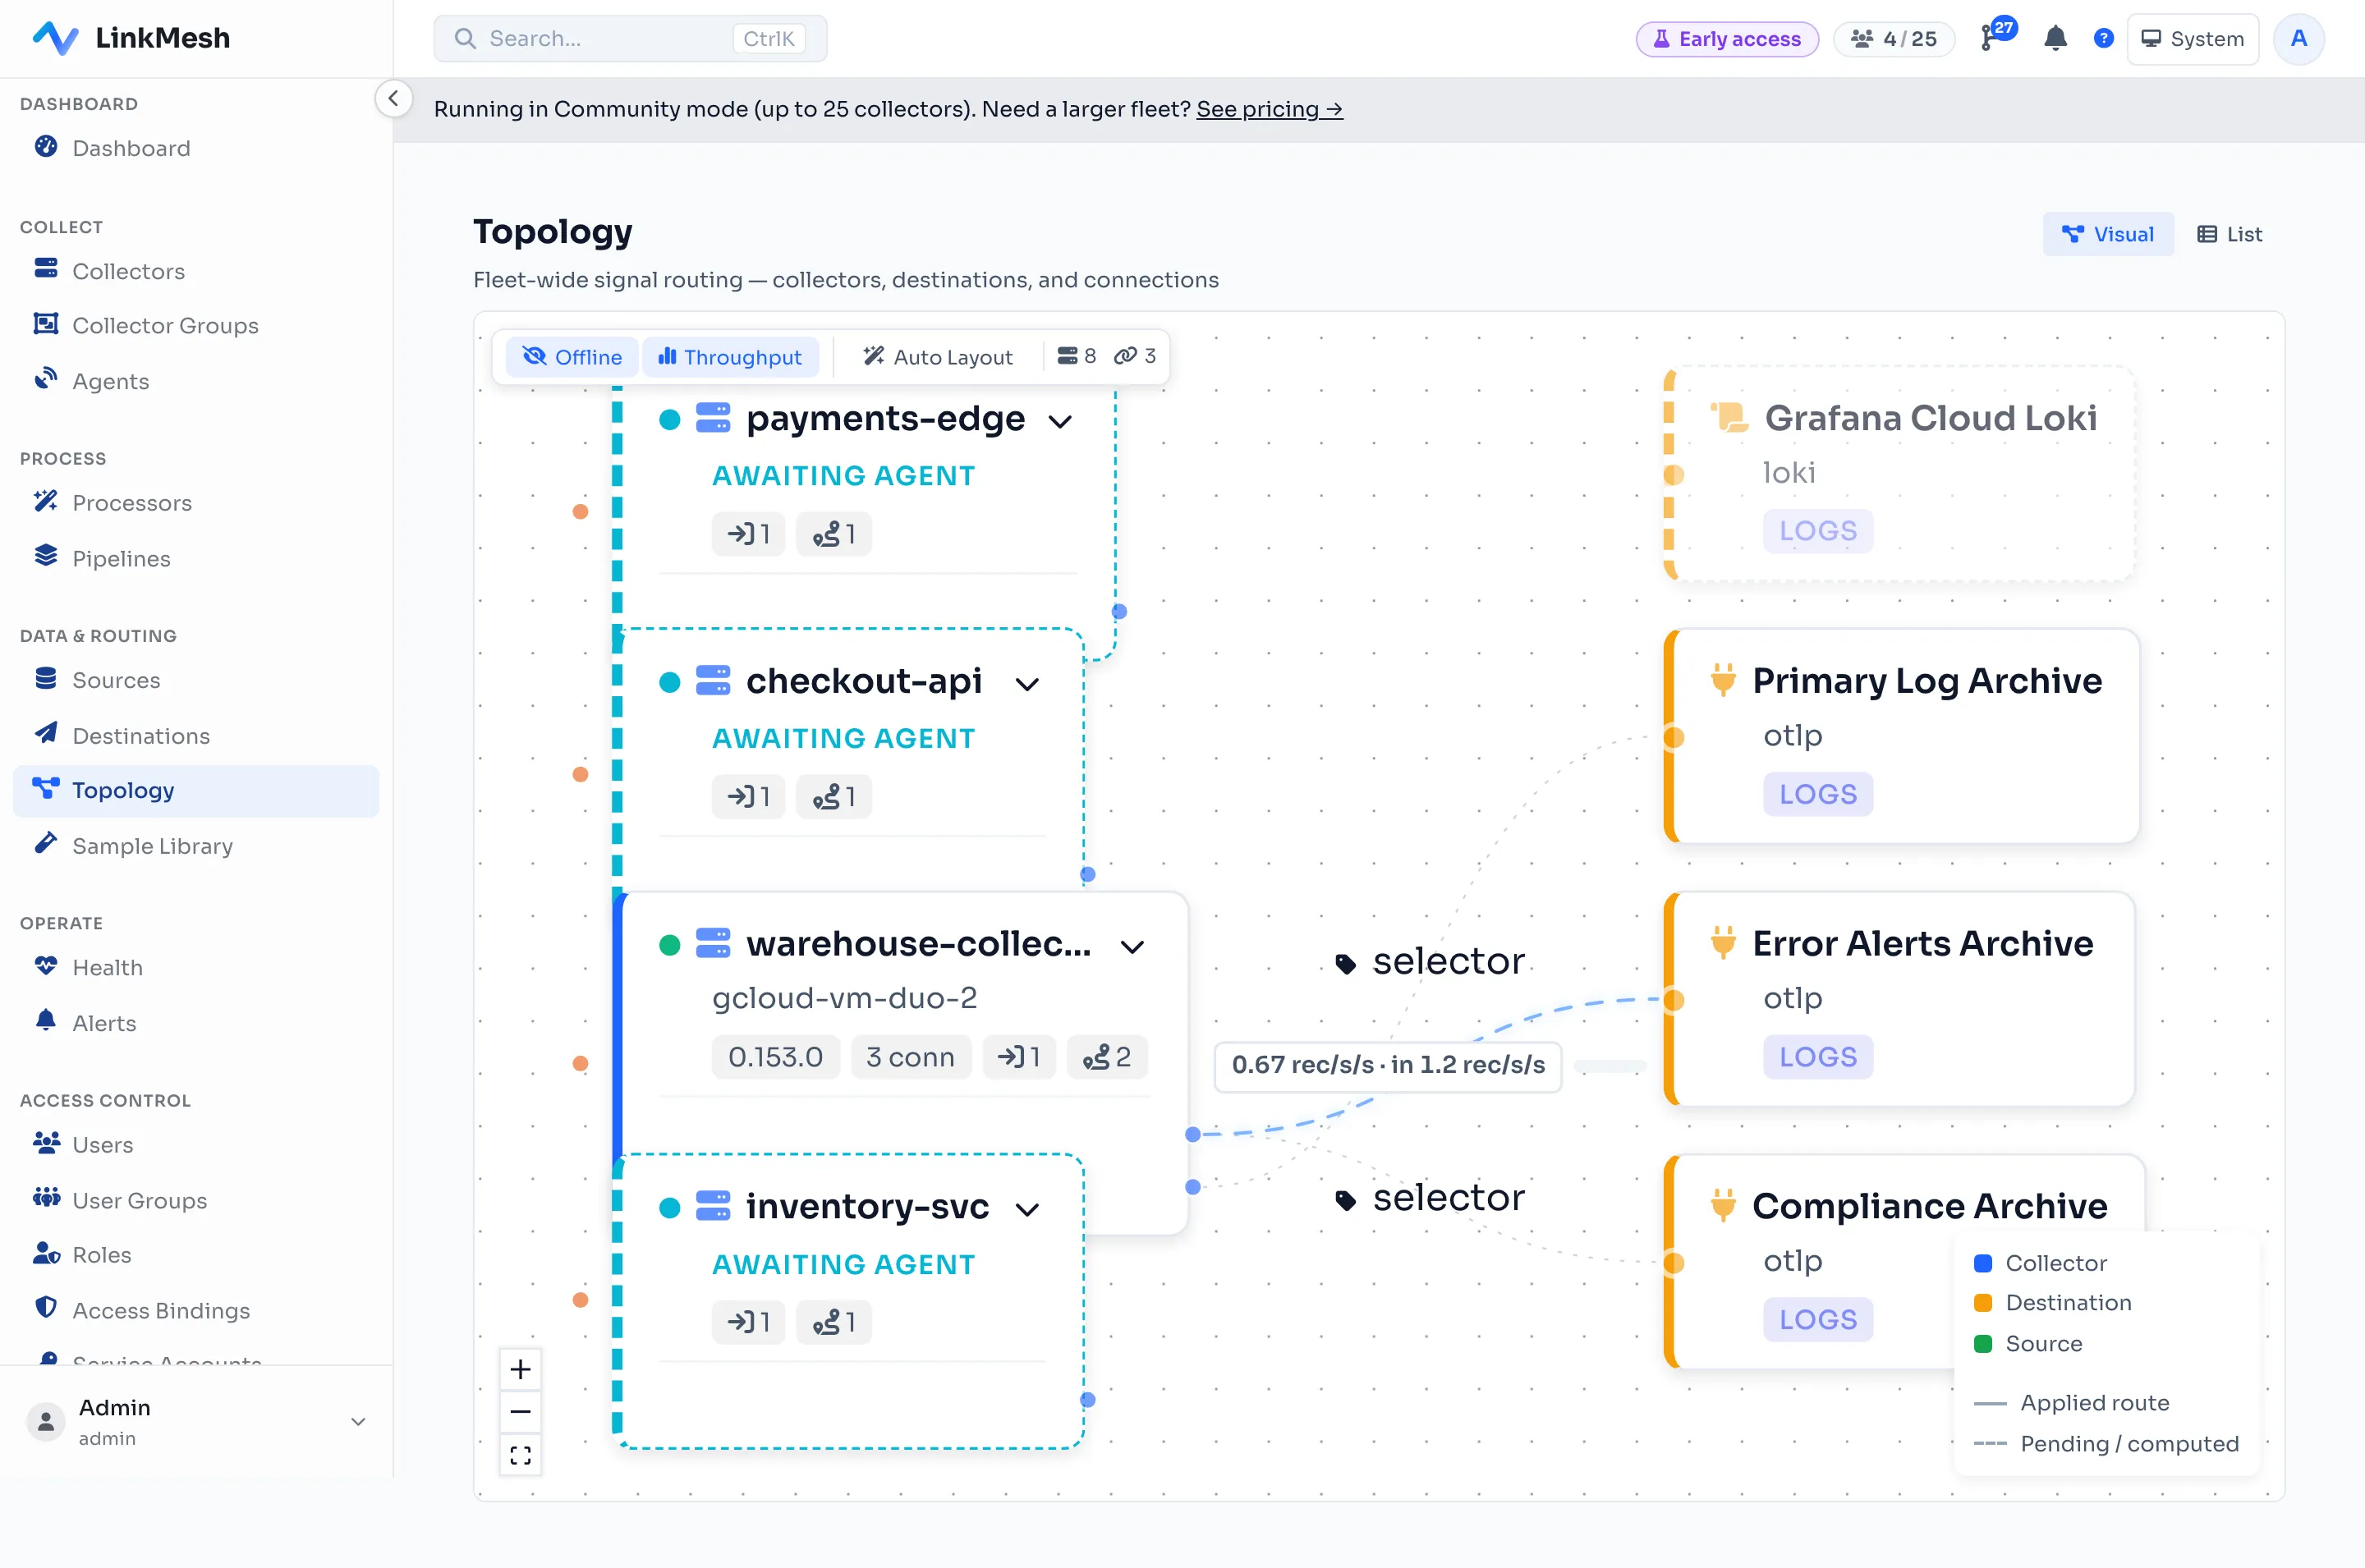
Send real traffic through and you can watch it happen: error-level records take the archive branch, everything else takes fallthrough, and the two edge counters prove the split rather than asserting it. (The same per-edge throughput view is what we lean on for measuring where observability spend actually goes — routing and cost control are the same muscle pointed at different goals.)
Step 5 — A second axis: joining destinations by label
Everything above is one axis — which telemetry goes where, decided by matching the record’s content. There’s a second, separate axis: which destinations a route’s match feeds, decided by matching a destination’s tags instead of the telemetry.
Tag a destination once —
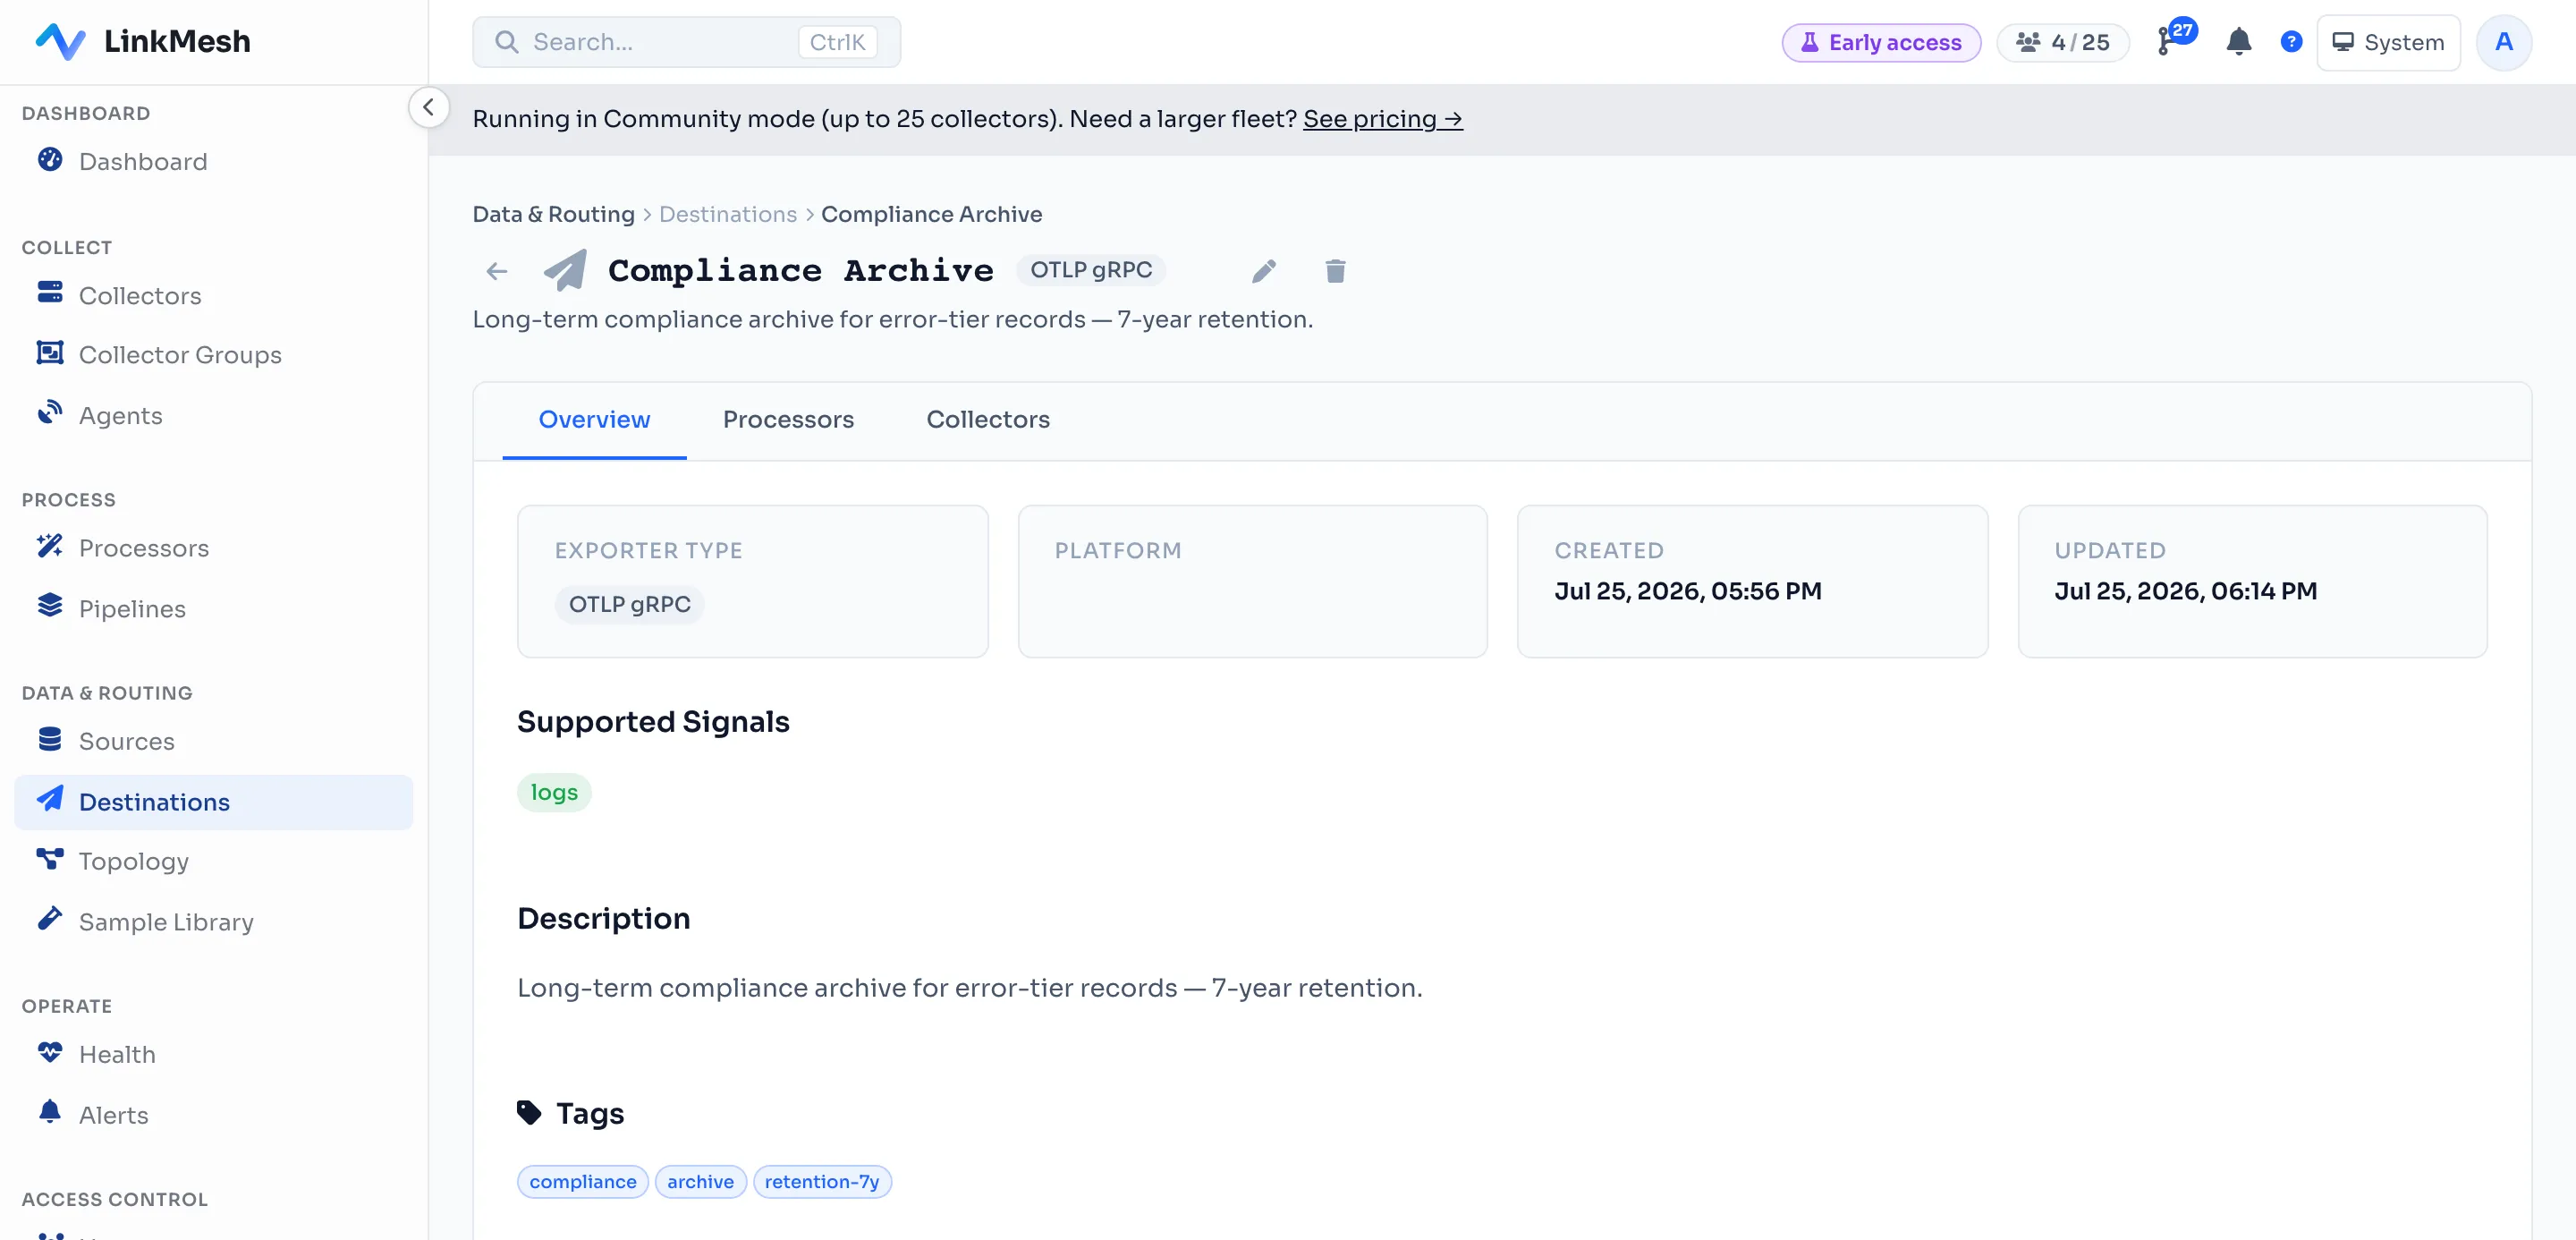
— and any route whose destinationSelector matches that tag picks it up automatically,
without you going back and wiring the destination into every route by hand. New
destination shares the tag, it joins every matching route; retag it, it drops out.
The canvas visualizes the join as a dashed ghost edge so you can see it without
digging into config:
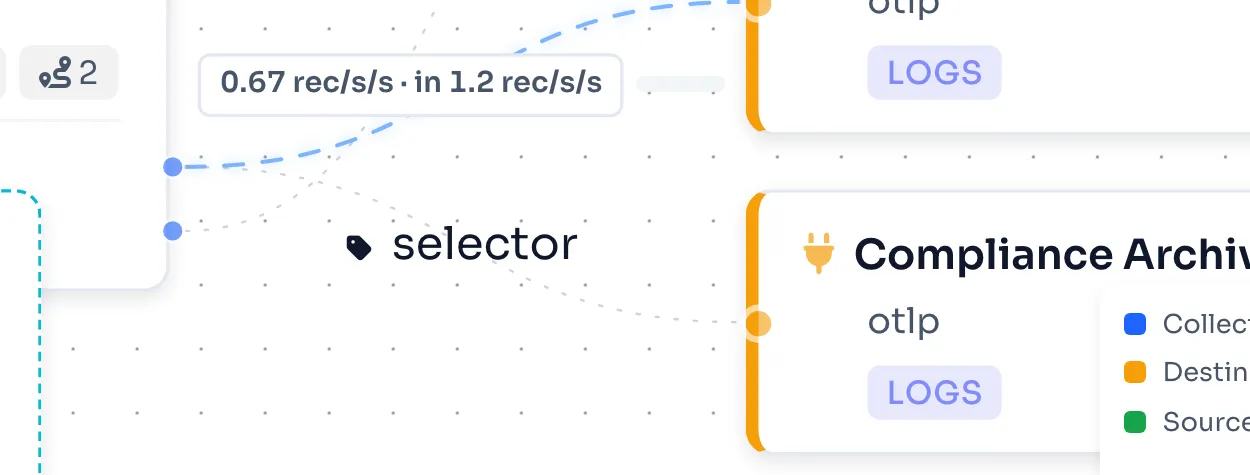
destinations:
  - name: cold-archive
    type: otlphttp
    endpoint: https://archive.internal:4318
    tags:
      tier: archive

routes:
  - name: errors-to-archive
    priority: 0
    match: 'severity_number >= SEVERITY_NUMBER_ERROR'
    destinationSelector:
      tier: archive
  - name: fallthrough
    priority: 1
    match: 'true'
    destinations: [default-egress]
Two honest limits on this, worth knowing before you lean on it. First, matching is
AND-equality only — a selector matches a destination whose tags equal what you
specified, on every key you list. There’s no In, NotIn, or “tag exists” operator
today. Second, there’s no UI yet for hand-authoring a custom selector; you set it via
the API or in the entity YAML, and the canvas’s job is to visualize the resulting
join, not to build it. If you need something more elaborate than “route X wants any
destination tagged tier=archive,” today that’s still a config file, not a form.
Don’t conflate the two axes
It’s easy to blur these together because they both use the word “route,” so it’s worth saying plainly: the match filter decides which telemetry a route accepts; the destination selector decides which destinations that route’s matched telemetry fans out to. One reads the record’s content. The other reads a destination’s tags. A route can have a narrow content match and a broad label-selected fan-out, or the reverse — they’re independent knobs, not two names for the same thing.
Where to start
- List your destinations by value, not by habit — which telemetry is actually queried, and which just needs to sit somewhere cheap for compliance.
- Write the narrow routes first, the catch-all last — priority order is the whole safety model, so specific conditions belong ahead of broad ones.
- Build the match with the field/operator/value picker; reach for Advanced OTTL only when a condition genuinely needs it.
- Tag destinations instead of hand-wiring them into every route that should reach them, and let the canvas’s ghost edges show you the result.
- Watch the per-edge throughput after you ship it — a route that looks right on paper still has to prove itself in records per second.
Splitting telemetry by what it actually is — not shipping everything to one backend because that’s the path of least resistance — is most of what turns a pipeline from a pass-through wire into something that earns its place between your services and your bill. (For where routing fits among the rest of a pipeline’s jobs, see our telemetry pipeline guide; for how LinkMesh compares to Cribl’s routing model specifically, see our Cribl alternatives rundown.)
LinkMesh routes telemetry by attribute with a field/operator/value builder (Advanced OTTL when you need it), joins destinations to routes by label instead of manual wiring, and shows you per-edge throughput so a route split is a number you can verify, not a hope. Stand one up in minutes, or see what it does.