
 LinkMeshObservability Data Collection Management
Debugging Telemetry Pipelines
When the collector runs but no data arrives.
 Roman Hüsler← Back to blog
There’s a special kind of frustration in telemetry work: the collector is running, its process is healthy, it reports no errors — and yet nothing shows up in your backend. Data goes in one end, nothing comes out the other, and the logs are cheerfully silent about why. This post is a practical guide to debugging that: the common failure modes, why the traditional approach is painful, and how live data capture turns “no idea” into “found it” in minutes. (New to the concept? Start with what a telemetry pipeline is.)
The debugging blindspot
The hard part of pipeline debugging is that a collector can be perfectly healthy while silently dropping your data. It’s not crashed, so there’s no stack trace. It’s not erroring, so the logs are empty. The data is simply being filtered, mis-routed, or rejected downstream, and nothing surfaces that to you. You’re left guessing which of a dozen stages is the culprit — blind.
Classic failure modes
Most “no data arriving” incidents come down to a handful of usual suspects:
- Exporter auth. The exporter is rejected by the backend — a wrong API token or malformed credentials returns a 401, and depending on config the collector may retry quietly rather than shout about it.
- Signal-type mismatch. A route or pipeline wired for the wrong signal — logs where metrics are expected, or a single-signal route spliced into a multi-signal chain — can produce an invalid graph the collector won’t even start, or a path that silently carries nothing.
- Silent drops by filters. A filter or sampling rule that’s slightly too aggressive discards more than you intended. Everything “works”; the data just quietly vanishes.
- Schema surprises. An attribute isn’t the type a downstream processor expects, or a field the exporter requires is missing, and records get dropped on the way out.
Every one of these is invisible from the outside. Knowing the list helps — but you still have to find which one, on which host, at which stage.
The old way: debug exporter and log spelunking
The traditional approach is to SSH into a host, add a debug/logging exporter to the collector config, restart it, and tail the logs to see what’s flowing. It works, but it’s slow and awkward: you’re editing production config to observe it, restarting the very thing you’re debugging (which can mask timing-dependent issues), doing it per host, and reading raw dumps in a terminal — often with sensitive fields in plain sight. By the time you’ve set it up, the transient issue may be gone.
Live capture: inspect real records without touching the host
A better approach is to tee a route — copy a sample of what’s actually flowing at a point in the pipeline, and inspect it in the UI, without editing config or restarting anything. That’s what LinkMesh’s live data capture does: you pick a route, capture a short sample of real records, and look at them directly.
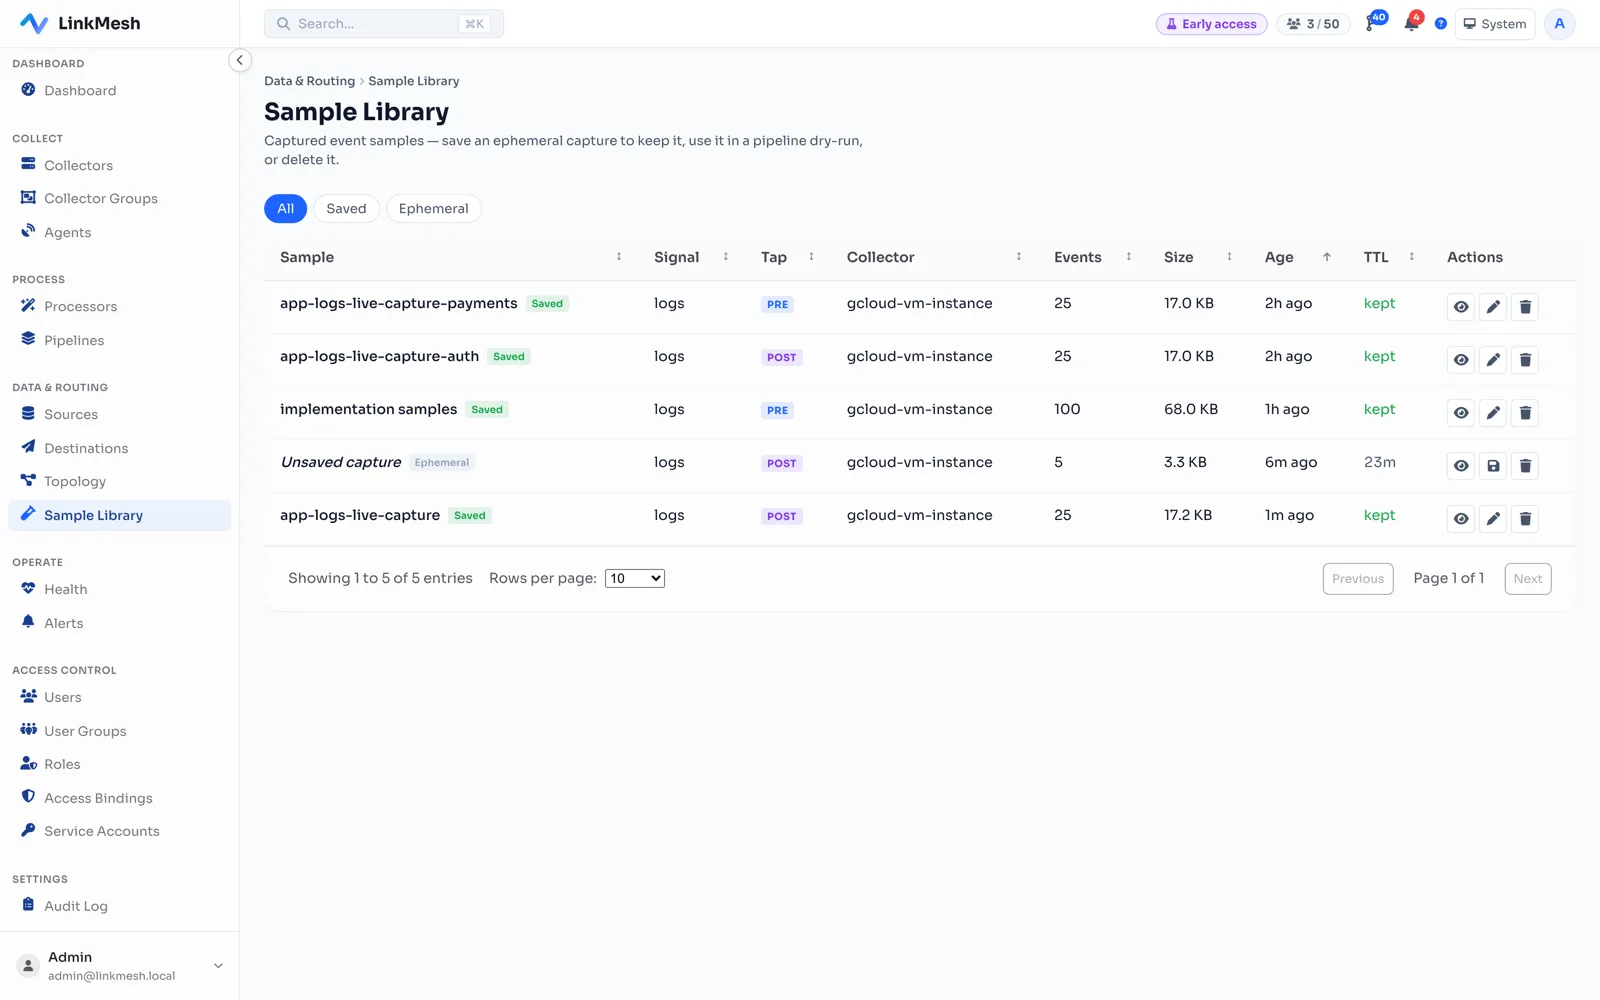
Three properties make it safe to use on production traffic:
- Redaction-safe. Capture runs after your redaction rules, so sensitive fields stay masked — you can debug without re-exposing the PII you carefully masked (see Masking PII in Logs).
- Ephemeral. Samples are short-lived and capped, not a permanent copy of your data — they exist to debug a problem, then expire.
- No restart. You’re observing the running pipeline, not editing and bouncing it, so you don’t perturb the thing you’re trying to catch.
Seeing the actual records answers half the questions immediately: is the data arriving at this point? Does it have the fields you expect? Is that attribute the type you assumed? Often the bug is obvious the moment you can see a real record.
Step through: find which processor eats your data
The other half of debugging is locating the exact stage where data disappears. Instead of guessing, step through the pipeline processor by processor and watch the record count at each step. The stage where the count drops to zero is your culprit:
Records enter at 100/s, survive the batch step at 100/s, and drop to 0/s right after the filter — so the filter is the culprit. That “before and after, one step at a time” view is exactly what LinkMesh’s processor preview gives you. Open any step in a pipeline and you get three panes side by side: the real records going in on the left, the processor’s configuration in the middle, and what comes out on the right — fed by a dry-run against a sample, so you can inspect it without touching the running collector.
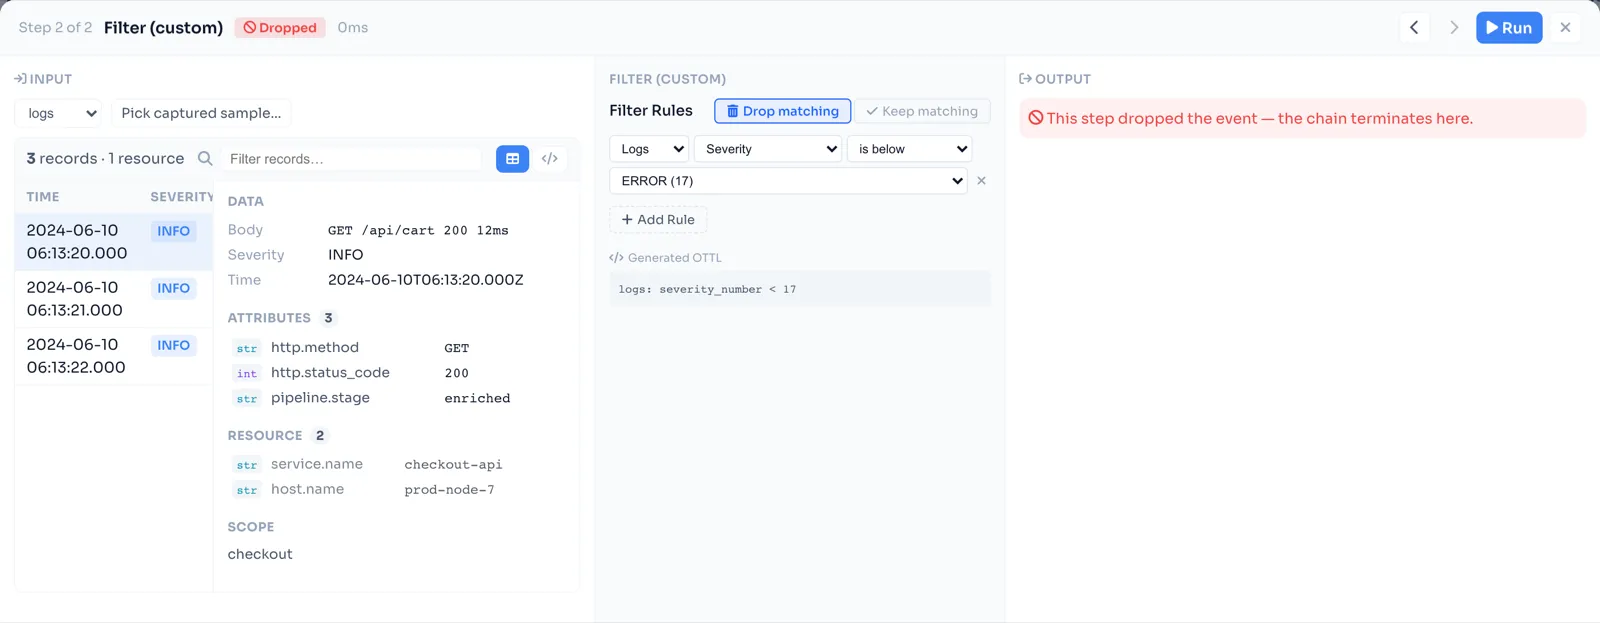
Here the story tells itself. Three log records enter the step — you can see them, real and
intact, down to their attributes. The middle pane shows the rule: drop matching — severity
is below ERROR. And the output is empty, flagged Dropped: “this step dropped the event
— the chain terminates here.” The filter was meant to keep only errors, but every record in
this stream is INFO, so it quietly eats all of them. The input pane proves the data
arrived; the output pane proves this is where it dies; the middle pane shows exactly why —
no guessing, no log spelunking.
From there it’s mechanical: use the previous/next arrows to walk the chain step by step, find the one where the output goes empty, fix its rule — here, invert the condition or drop the step — and re-run the same sample to confirm the records now survive to the end. A half-day of log spelunking becomes a glance.
A 10-minute pipeline triage
When data stops arriving, work it in this order rather than guessing:
- Is it healthy? Confirm the collector is up and reporting — rule out “it’s just down.”
- Capture at the source. Tee the incoming route. If nothing’s captured, the problem is upstream (the source or the sender), not your pipeline.
- Capture at the exporter. If data’s there but not reaching the backend, suspect exporter auth or the destination — check for 401s.
- Step through the middle. If it enters but doesn’t exit, step processor by processor and find where the count drops.
- Inspect a real record. Check field names and types against what the failing stage expects — schema mismatches hide here.
Most incidents fall out of steps 2–4 in a few minutes, because you’re looking at the data instead of inferring it. (Cost-tuning your pipeline once it works? See Reduce Observability Costs.)
The recurring theme across this blog holds here too: a pipeline you can see into is a pipeline you can operate. LinkMesh captures real records per route, redaction-safe and ephemeral, and steps through processors so “no data arriving” becomes a five-minute fix instead of a bad afternoon. Try it at linkmesh.io/install.