
 LinkMeshObservability Data Collection Management
Introducing LinkMesh
Control your telemetry before it controls your costs.
 Philippe Braxmeier← Back to blog
OpenTelemetry Collectors are a fantastic building block. One per host, they receive, process, and export your telemetry with a clean, vendor-neutral config. But that per-host strength turns into a fleet problem the moment you run more than a handful: every collector is its own island, with its own config file, its own version, and its own way of drifting out of line.
Here’s what that looks like in practice today — and how LinkMesh changes it.
The fleet problem: dozens of islands, no map
Today, you roll collectors out with Ansible, Puppet, or a pile of shell scripts, and from then on each host is on its own. Which collectors are actually running? Which version? Which are still on last month’s config? Answering that means SSH-ing around or trusting that your config-management tool converged everywhere. Version skew and silent drift become the normal state, not the exception — and you usually find out something’s wrong when data stops arriving.
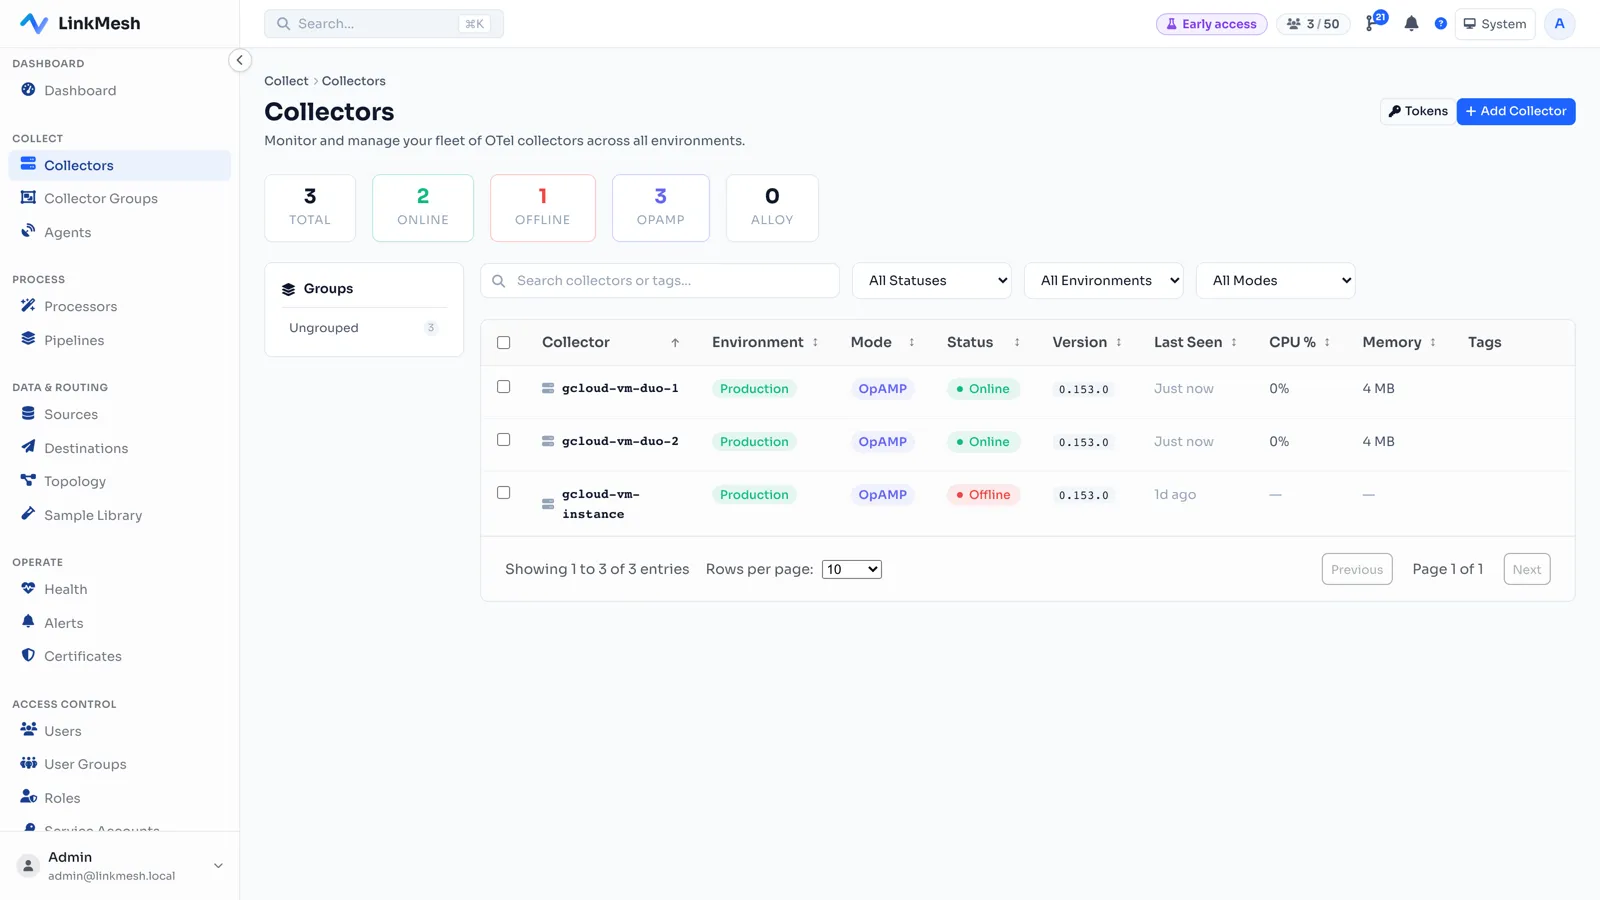
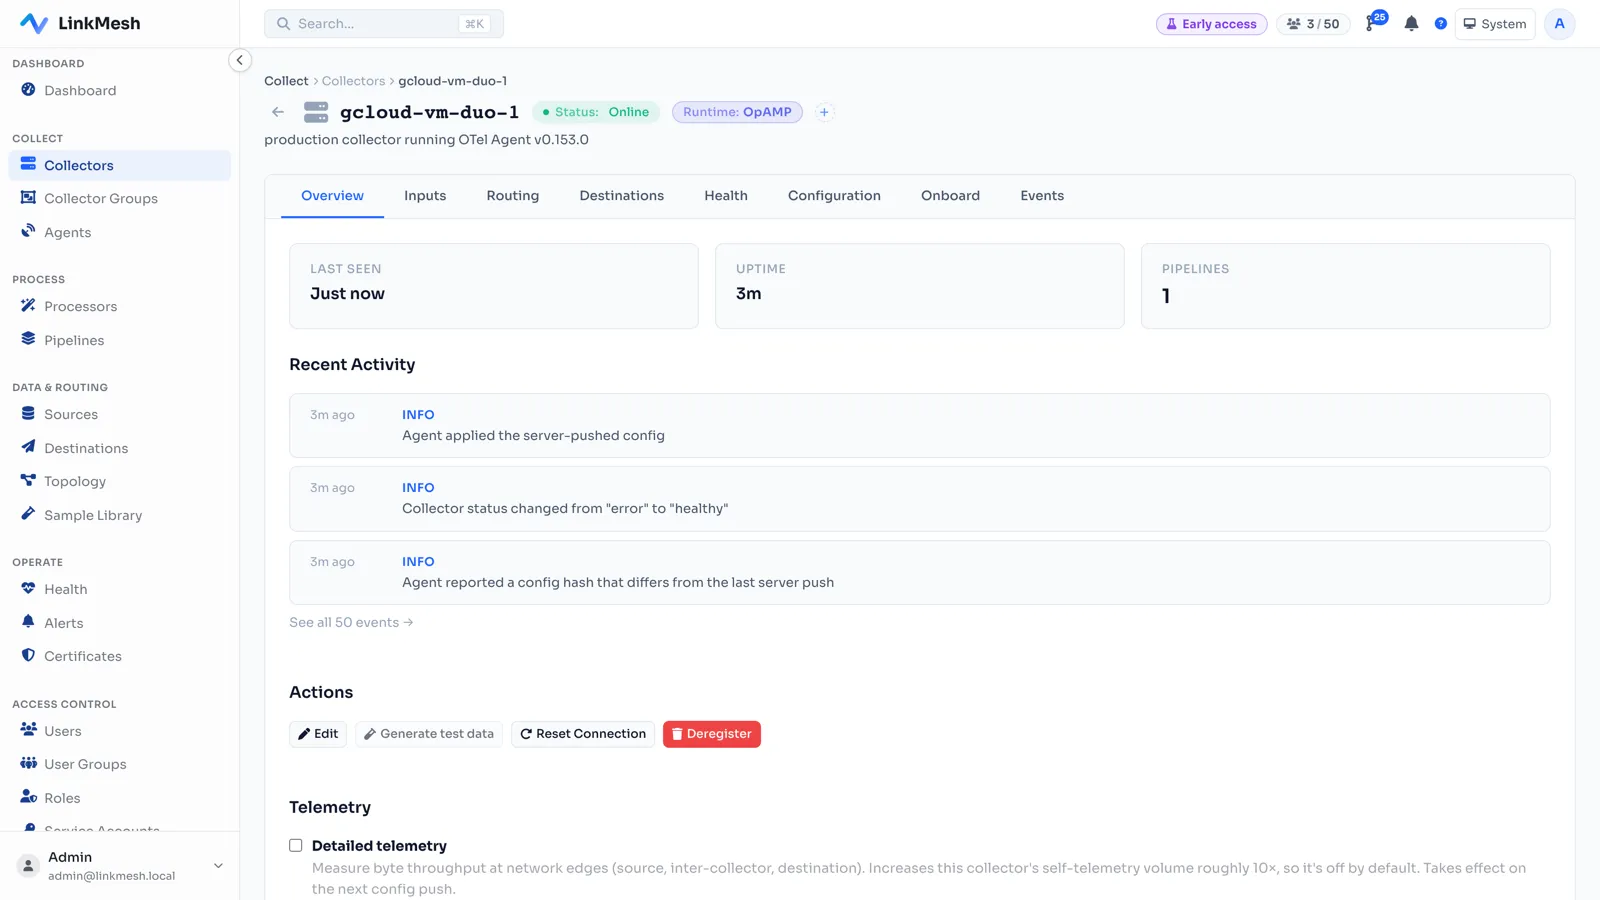
With LinkMesh, every collector enrolls with the control plane over a single outbound connection on port 443 — otelcol-contrib via OpAMP, Grafana Alloy via remotecfg. No inbound ports, no per-host certificates to rotate. One fleet view shows status, version, throughput, and config state for every node, so “which collectors are on the old config?” is a glance, not an investigation.
Changing the pipeline: edit one file × N hosts, and hope
Today, adding a processor or routing a new log source means editing a config file — then editing it on every host, or updating a playbook and running it and hoping nothing drifted out-of-band since last time. Then you restart the collectors. If there’s a typo or an invalid receiver, you don’t find out until a collector fails to start and ingestion silently stops. Rolling back means running the whole tool again. There is no “edit once, apply everywhere, safely.”
With LinkMesh, you edit the pipeline once in the control plane — sources, processors, routes, destinations. LinkMesh renders the collector config, validates it, and pushes it to the right collectors, hot-reloading where possible and restarting only where needed. The pipeline lives in one versioned place, so there’s nothing to hand-edit per host and nothing to drift.
The bill you can’t see coming
Today, observability spend is a black box until the invoice lands. You can’t easily see which source or pipeline is generating the volume you’re paying a vendor to ingest — so cost control is reactive: get surprised, then go hunting for the noisy service after the money’s already spent.
With LinkMesh, every edge of the pipeline shows events per second, and — for collectors that opt in — measured bytes per second at the network boundaries. You can see exactly where volume enters, where a route sheds it, and what actually reaches each destination, before the bill tells you. Drop, sample, or reroute the noise at the source instead of paying to store it.
Your data, your network, a predictable price
Today, SaaS pipeline tools mean your telemetry — which often carries sensitive data — leaves your network to be managed by someone else, and per-gigabyte pricing punishes you exactly when you grow.
With LinkMesh, it runs on your own infrastructure. Your telemetry never leaves your network to be managed, and pricing is per collector, not per gigabyte — so scaling your data doesn’t scale your bill.
Ready to try it? Head to linkmesh.io/install to stand up a control plane and enroll your first collector in a few minutes.