

 LinkMeshObservability Data Collection Management
KVM & libvirt → Grafana
Host metrics, per-domain stats, and the libvirt journal — one collector per hypervisor.
 Roman Hüsler← Back to blog
Plain KVM is the honest hypervisor: it gives you virsh, a kernel module, and nothing
else. No vCenter, no cluster web UI, no built-in graphs — which is exactly why people
choose it, and exactly why KVM monitoring is something you have to build rather
than enable. virsh domstats tells you what a domain is doing right now; the moment
someone asks “was VM 7 already swapping before the migration?”, there is no history to
answer with.
The OpenTelemetry Collector closes that gap with one systemd service per hypervisor.
There is a caveat worth naming in the first paragraph, because it decides the shape of
this guide: the Collector has a native receiver for VMware vCenter and none for
libvirt — we checked the contrib receiver list for this post (collector v0.164.0,
2026-11-02) and there is no libvirt receiver, nor an open component for one. So host
metrics and logs come from the Collector directly, and per-VM metrics come from a
libvirt exporter the Collector scrapes. That is three receivers and no agent inside any
guest.
Admins running libvirt/KVM directly — a pair of hypervisors under
qemu:///system, a rack of them, or the hosts underneath an orchestration layer you
don’t want to monitor through. You need root on the hosts and a Grafana target
(self-hosted Grafana + Prometheus/Loki, or Grafana Cloud’s free tier). No Proxmox, no
OpenStack, no oVirt required — if you do run one of those, see the links below
instead; they each have a better path than this one.
Running a management layer on top of KVM? Then monitor that layer, not the bare hypervisor: Proxmox VE with OpenTelemetry and Grafana uses Proxmox’s native OTLP push, and OpenStack monitoring vs. observability covers the control-plane services that bare libvirt doesn’t have. Comparing the two platforms: OpenStack vs. Proxmox observability. Coming from VMware, where a native receiver does exist: what happens to monitoring.
What you’ll have when you’re done
- Every hypervisor’s CPU (including steal and IO wait), memory, disks, and network in one Grafana dashboard, with real retention.
- Per-domain metrics for every VM — vCPU time and wait, balloon and RSS memory, block device read/write bytes and latency, interface bytes, drops and errors — read from libvirt itself, with no agent inside the guests.
- Storage pool capacity and allocation per pool, so “the images pool filled up” is a trend you watched rather than an outage you discovered.
- The libvirt journal of every host searchable in one place —
libvirtdor the modularvirtqemud/virtnetworkd/virtstorageddaemons, plusvirtlogd— instead of SSH-ing around withjournalctl. - Live-migration jobs as metrics, which is the one thing
virshgenuinely cannot show you after the fact.
How it maps to what you already use
Nothing here is a new concept — it’s the libvirt tooling you know, pointed at Grafana:
| You know it as… | OpenTelemetry gets it via… | In the config it’s called |
|---|---|---|
htop, iostat, df -h on the host |
the host-metrics collector | hostmetrics |
virsh domstats, virsh domblkstat |
a libvirt exporter, scraped | prometheus/libvirt |
virsh pool-list --details |
the same exporter’s pool metrics | prometheus/libvirt |
journalctl -u libvirtd |
the journald reader | journald |
ps aux on the qemu processes |
the host-metrics process scraper | hostmetrics / process |
| An external metric store | the destination it sends to | exporters |
Step 1 — Install a pinned Collector release on each hypervisor
A KVM host is a normal Linux box, so the Collector installs like any other package.
Pick a tested version from the official releases
— the assets carry the version in the filename, so there is no stable “latest” URL, and
pinning a version you’ve tested beats installing whatever shipped last night. The
example uses 0.164.0; substitute the version you chose:
OTEL_VERSION="0.164.0"

wget "https://github.com/open-telemetry/opentelemetry-collector-releases/releases/download/v${OTEL_VERSION}/otelcol-contrib_${OTEL_VERSION}_linux_amd64.deb"

dpkg -i "otelcol-contrib_${OTEL_VERSION}_linux_amd64.deb"
(An RPM asset exists for RHEL-family hosts — the rest of this guide is identical.)
You want the contrib build: the journald reader and the prometheus receiver both
ship there, and neither is in the core distribution. The package registers a systemd
service (otelcol-contrib) running as its own unprivileged user, also named
otelcol-contrib — that detail matters twice, in Step 4 and Step 5. The configuration
lives at /etc/otelcol-contrib/config.yaml; that’s the one file you’ll edit.
Step 2 — Choose your backend: self-hosted or Grafana Cloud
Self-hosted Prometheus + Loki — the natural choice if you run bare KVM, and the path where telemetry never leaves your network. Two things to switch on:
- Prometheus must be started with
--web.enable-otlp-receiverto accept OTLP; its ingest path is/api/v1/otlp/v1/metrics. - Loki 3.x accepts OTLP natively under
/otlp(on older 2.9-era versions, structured metadata must be enabled first).
Grafana Cloud (the free tier is enough to start): Connections → OTLP → “Send
data”, and copy the two things it shows you — the OTLP endpoint
(https://otlp-gateway-<zone>.grafana.net/otlp) and the Authorization header (a
Basic … token). Collection still runs entirely on your hosts; only the export leaves
them, over TLS.
Both variants are included in the download below, so you only ever uncomment one.
Step 3 — Configure host metrics and the libvirt journal
You do not need to write this from scratch. Download the ready-made file, drop in
your backend values from Step 2, and save it over /etc/otelcol-contrib/config.yaml:
⬇ Download the ready-to-use KVM/libvirt config (config.yaml)
The two blocks that need no extra software at all:
receivers:
  hostmetrics:
    collection_interval: 30s
    scrapers:
      cpu: {}
      memory: {}
      load: {}
      disk: {}
      filesystem: {}
      network: {}
      paging: {}
      process:                 # per-qemu-system process CPU and RSS
        mute_process_name_error: true
        mute_process_exe_error: true
        mute_process_io_error: true

  journald:
    units:
      - libvirtd              # monolithic daemon (older setups)
      - virtqemud             # modular daemons (libvirt 5.6+, default on new distros)
      - virtnetworkd
      - virtstoraged
      - virtlogd
priority: infohostmetrics— the host basics, with history. On a hypervisor the two series nobody should run without are the CPUwaitstate (storage is slow) andsteal(you’re overcommitted, or your own host is a guest somewhere).- The
processscraper is the cheap per-VM signal that needs no exporter: every running domain is aqemu-system-x86_64process, so you get its CPU and resident memory for free. It is also the noisiest scraper in the set — one series group per process — so treat it as a complement to Step 4, not a replacement, and drop it if cardinality bites. journald— list bothlibvirtdand the modular daemons. Modern distributions ship the modular split (virtqemudet al.) andlibvirtdis then a compatibility shim that logs almost nothing; older hosts are the reverse. A unit that doesn’t exist on a host is simply silent, so one list works for a mixed fleet.virtlogdis the one most people forget, and it’s where a guest’s own serial console output lands.
The rest of the file is production hygiene — a memory_limiter capping the Collector
at 256 MiB so it never competes with your guests for RAM, resourcedetection/system
stamping host.name on everything (that becomes the host_name label you filter by in
Grafana — without it the queries below have nothing to group on), and batch.
Step 4 — Per-VM metrics: scrape a libvirt exporter
This is the step that makes it KVM monitoring rather than generic Linux monitoring.
Since there is no libvirt receiver, the Collector reads libvirt through an exporter.
The maintained choice is
inovex/prometheus-libvirt-exporter
— a single Go binary, actively released (v2.6.2 as of 2026-10-21), that talks to the
libvirt socket and serves Prometheus metrics on port 9177, path /metrics.
Install it as a systemd service on each hypervisor. The two flags that matter:
prometheus-libvirt-exporter \
  --libvirt.uri /var/run/libvirt/libvirt-sock-ro \
--exporter.max-concurrent-collects 4- The default URI is the read-only socket (
libvirt-sock-ro). Keep it that way: a metrics collector has no business holding a read-write handle to your hypervisor. --exporter.max-concurrent-collectsdefaults to 4 and the exporter’s own README says to match libvirtd’smax_client_requeststo it. On a host with many domains, a mismatch here is what turns a scrape into an exporter timeout.
The exporter’s service user needs to read that socket — on Debian/Ubuntu and
RHEL-family hosts that means membership in the libvirt group:
usermod -aG libvirt prometheus-libvirt-exporterThen point the Collector at it. The exporter runs on the same host, so loopback is enough and nothing has to listen on the network:
receivers:
  prometheus/libvirt:
    config:
      scrape_configs:
        - job_name: libvirt
          scrape_interval: 30s
          static_configs:
            - targets: ["127.0.0.1:9177"]
Add prometheus/libvirt to the metrics pipeline’s receivers list, and that’s the
whole integration. What arrives is per-domain, labelled with the domain name — these
names are verified against the exporter’s own documented metric set:
| What you want to see | Metric |
|---|---|
| Is the domain running? | libvirt_domain_info_state |
| vCPU time, and vCPU wait | libvirt_domain_vcpu_time_seconds_total, libvirt_domain_vcpu_wait_seconds_total |
| Memory actually in use vs. balloon | libvirt_domain_memory_stats_rss_bytes, …_current_balloon_bytes, …_used_percent |
| Guest swapping (the early warning) | libvirt_domain_memory_stats_swap_in_bytes |
| Virtual disk throughput and latency | libvirt_domain_block_stats_read_bytes_total, …_write_time_seconds_total |
| Virtual NIC errors and drops | libvirt_domain_interface_stats_receive_drops_total, …_transmit_errors_total |
| Storage pool fill | libvirt_storage_pool_allocation_bytes / libvirt_storage_pool_capacity_bytes |
| A live migration in flight | libvirt_domain_job_type, libvirt_domain_job_data_remaining_bytes |
| Exporter couldn’t read a domain | libvirt_domain_timed_out |
Two of those deserve a sentence. libvirt_domain_vcpu_wait_seconds_total is the
metric that answers “the VM feels slow but its CPU isn’t busy” — it’s time the vCPU
spent waiting rather than running, and it is invisible from inside the guest.
And libvirt_domain_timed_out is the metric that tells you your monitoring is
lying to you: a domain the exporter could not read in time produces no stats, and
without this series that looks identical to a healthy idle VM.
Step 5 — Let the Collector read the journal
The DEB runs the Collector as the unprivileged otelcol-contrib user, which out of the
box is not allowed to read the system journal. Grant it the group:
usermod -aG systemd-journal otelcol-contrib
systemctl restart otelcol-contrib
And prove it worked as the service user, which is the only test that counts:
sudo -u otelcol-contrib journalctl -u virtqemud -n 5If that prints five journal lines, the Collector can read them too. Resist running the
service as root — the group is all it needs. Note that the Collector does not need
the libvirt group: it never talks to libvirt, only to the exporter’s HTTP port.
Step 6 — Validate, then verify
Always validate before restarting — a typo caught by the validator is a typo that never takes your telemetry down:
otelcol-contrib validate --config /etc/otelcol-contrib/config.yaml
systemctl restart otelcol-contrib
systemctl status otelcol-contrib
Then check the data end-to-end:
- Confirm the exporter first, on its own:
curl -s localhost:9177/metrics | grep libvirt_domains. A number greater than zero means libvirt answered. If this is empty, nothing downstream can work and the problem is the socket permission from Step 4, not the Collector. - Open Grafana → Explore, pick your metrics data source, and filter on
host_name— withresourcedetection/systemin place, every hypervisor reports under its hostname. Host metrics appear within a minute; the libvirt series follow on the next scrape. - Switch the data source to Loki and query
{host_name="kvm1"}— the host’s libvirt journal is now searchable. Nohost_namelabel? Check thatresourcedetection/systemis listed in the logs pipeline too; the label exists only because that processor puts it there.
Step 7 — The queries and the alerts worth having
Start from these; they cover most of what actually goes wrong on a KVM host.
# Hypervisor CPU stolen or waiting on IO — the "everything is slow" pair
sum by (host_name, state) (rate(system_cpu_time_seconds_total{state=~"wait|steal"}[5m]))

# vCPU wait per domain: contention the guest itself cannot see
rate(libvirt_domain_vcpu_wait_seconds_total[5m])

# Storage pool fill ratio, per pool
libvirt_storage_pool_allocation_bytes / libvirt_storage_pool_capacity_bytes

# A guest that started swapping — memory pressure, before the complaints
rate(libvirt_domain_memory_stats_swap_in_bytes[15m]) > 0| Alert | Signal | Why |
|---|---|---|
| Storage pool > 85% allocated | libvirt_storage_pool_allocation_bytes / …_capacity_bytes |
A full pool stops guest writes dead. Trend it — time-to-full beats a threshold. |
| Domain stopped that should be running | libvirt_domain_info_state |
Catches a crashed or OOM-killed VM nothing else is watching. |
| Sustained vCPU wait | libvirt_domain_vcpu_wait_seconds_total |
The host is overcommitted. Invisible inside the guest, so you hear it as “the app is slow”. |
Host CPU steal or wait sustained |
hostmetrics CPU states |
Storage or overcommit; the earliest signal on a converged host. |
| Guest swap-in > 0 | libvirt_domain_memory_stats_swap_in_bytes |
Balloon pressure or an under-sized VM, caught before it thrashes. |
| Virtual NIC drops rising | libvirt_domain_interface_stats_receive_drops_total |
A bridge or offload problem that looks like “the network is flaky”. |
| Domains unreadable by the exporter | libvirt_domain_timed_out |
Your per-VM metrics are silently incomplete. Alert on it, or trust nothing above. |
| libvirt errors in the journal | virtqemud / libvirtd messages |
Failed starts and migration errors arrive here first. |
What this setup deliberately does not see
Being clear about the edges is what makes the rest trustworthy:
- Inside the guests. libvirt sees a domain from the outside: it knows the RSS of the
VM’s memory, not that the guest’s
/varis 97% full. Filesystem usage, process state and application logs need something in the guest — theqemu-guest-agentgets youvirsh domfsinfo, and anything beyond that is a Collector in the VM like on any other Linux box. - Nested hypervisor health. Nothing here knows your guest is itself a hypervisor.
- Cluster semantics. Bare KVM has no cluster, so there is no quorum, no HA stack and no fencing to monitor. If you have those, you have Proxmox, OpenStack or oVirt — and the platform’s own telemetry beats inferring it from libvirt.
Optional — Manage a KVM Collector fleet with LinkMesh
The setup above is complete; everything from here is about running it at scale. One hypervisor is a file you edit. Twelve across two sites, each with a Collector and an exporter to keep in step, is a fleet — and hand-editing YAML over SSH is exactly the toil that makes a monitoring rollout stall at host three.
OpenTelemetry’s answer to fleet management is OpAMP: a small
supervisor runs next to the Collector and manages its configuration — a bare
otelcol-contrib phones nowhere by itself. LinkMesh ships exactly that
pairing as a self-hosted control plane, which matters here, because nobody running
their own hypervisors wants their infrastructure telemetry managed from someone else’s
cloud. Once the config works on one host, enroll each Collector with a token and
LinkMesh distributes and versions the tested configuration across the fleet — every
change previewed, versioned and audited, while the telemetry itself still flows straight
from each host to your backend.
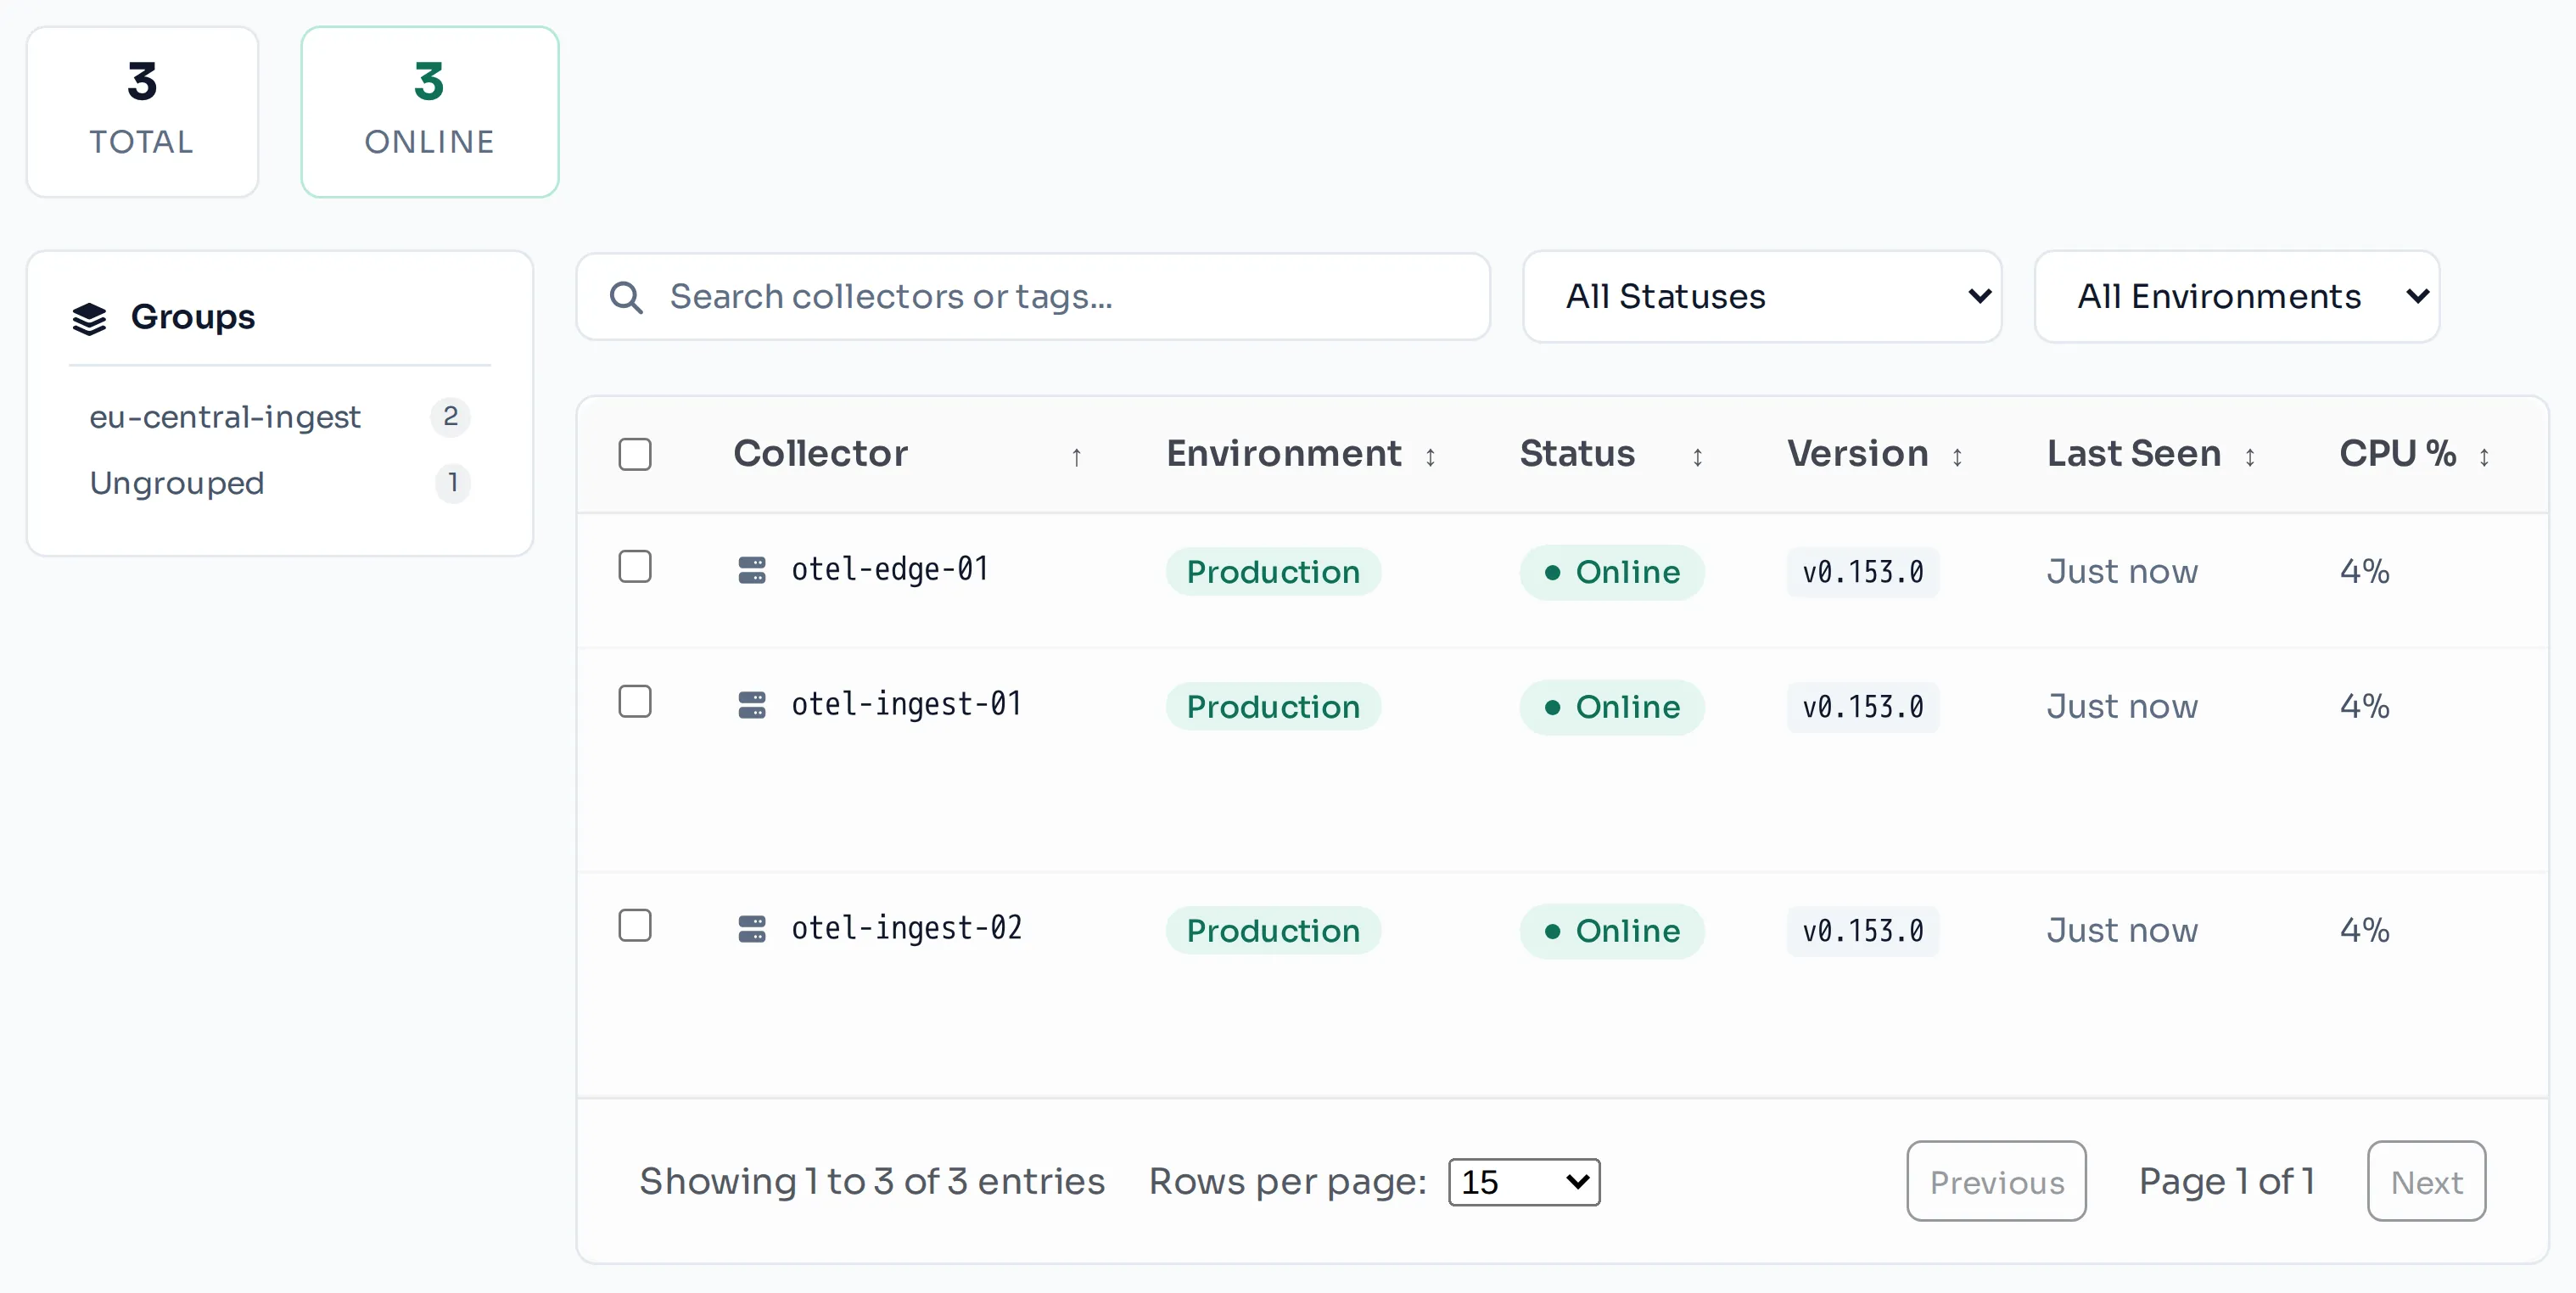
It’s priced per managed collector, not per gigabyte, so a chatty libvirt journal doesn’t turn into a volume bill — and at fleet scale it’s also the place to keep every host’s config from drifting after that one 2 a.m. hotfix.
Troubleshooting
- Service won’t stay running — run
otelcol-contrib validate --config /etc/otelcol-contrib/config.yaml; it prints the exact YAML error and the line. libvirt_domainsis 0, or the exporter returns almost nothing — the exporter’s user cannot reach the libvirt socket. Test it as that user:sudo -u prometheus-libvirt-exporter virsh -c qemu:///system list. The fix is thelibvirtgroup (Step 4), not a root service.- Scrapes time out on a busy host — raise
--exporter.timeout, and align--exporter.max-concurrent-collectswith libvirtd’smax_client_requestsin/etc/libvirt/libvirtd.conf. Lengthenscrape_intervalbefore you lengthen the timeout. - Host metrics fine, no per-domain metrics —
prometheus/libvirtis missing from the metrics pipeline’sreceiverslist. Defining a receiver does not enable it; only the pipeline does. - No journal entries in Loki — the
otelcol-contribuser must be in thesystemd-journalgroup (Step 5). Test exactly what the service sees:sudo -u otelcol-contrib journalctl -n 5. - The journal is empty but libvirt is clearly busy — you listed the wrong daemon.
Run
systemctl list-units 'virt*' libvirtdand keep what actually exists; modular hosts log undervirtqemud, notlibvirtd. - No
host_namelabel —resourcedetection/systemmust be listed in both pipelines. - Metric names don’t match the table above — you’re on a different exporter. Several
forks of the archived
kumina/libvirt_exporterare still circulating with different names and labels; checkcurl localhost:9177/metrics | head -50and go by what your binary actually emits.
KVM gives you the hypervisor; it never promised you the observability stack. One package, one exporter, one config file — and every host reports to Grafana, on your terms, on your network.
Validated collector configs for these steps, each checked against the real collector: read systemd journal logs (journald), scrape Prometheus metrics endpoints and collect host metrics.
LinkMesh manages the Collector on every hypervisor from one self-hosted control plane — edit once, preview, and deploy over OpAMP with versioned, audited rollouts, priced per collector rather than per gigabyte. Stand one up in minutes, or see what it does.