
 LinkMeshObservability Data Collection Management
Storage Monitoring with OTel
The 10 metrics that matter — capacity, performance, health — from one collector.
 Roman Hüsler← Back to blog
Storage is where outages hide. A volume fills up and a database goes read-only; a disk starts failing and latency cascades through every service on it; a snapshot schedule silently eats the array. None of it is dramatic until it is — and storage monitoring is usually the most fragmented corner of the stack, split across array consoles, per-host tools, cloud dashboards, and a spreadsheet.
You can pull it together with the same OpenTelemetry Collector you already run for everything else. Below are the 10 storage metrics worth tracking — grouped into capacity, performance, and health — and how to collect each from servers and storage arrays, into one backend (Grafana or anything OTLP), with alerting across the whole fleet.
Platform, sysadmin, and infrastructure teams responsible for storage on servers, VMs, and arrays who want one consolidated, vendor-neutral view instead of a console per vendor. Prerequisites: an OpenTelemetry Collector on your hosts (or a gateway), and a metrics backend such as Prometheus/Mimir + Grafana.
The storage monitoring matrix
Ten metrics answer the questions that actually page you. Each maps to something the
OpenTelemetry Collector can collect — mostly the hostmetrics receiver’s disk and
filesystem scrapers, with a prometheus or snmp receiver for physical health and
arrays.
| # | Metric | Why it matters | Where OTel gets it |
|---|---|---|---|
| 1 | Capacity used % | The classic outage cause — full = read-only or crash. | hostmetrics filesystem |
| 2 | Free space & time-to-full | Trend beats threshold; predict the wall before you hit it. | hostmetrics filesystem (rate) |
| 3 | Inode / metadata usage | Runs out before bytes do on many-small-files workloads. | hostmetrics filesystem inodes |
| 4 | IOPS (read/write) | The unit most arrays and cloud disks are provisioned by. | hostmetrics disk operations |
| 5 | Throughput (read/write) | Bytes/sec — bandwidth saturation and backup windows. | hostmetrics disk io |
| 6 | I/O latency | The number that turns “slow app” into “slow disk”. | derived from disk operation_time |
| 7 | Queue depth | Pending I/O — the early sign of saturation. | hostmetrics disk pending_operations |
| 8 | Disk utilization / saturation | % of time the device is busy. | hostmetrics disk io_time |
| 9 | Disk health / SMART | Predicts physical failure before it takes data. | smartctl_exporter via prometheus receiver |
| 10 | Array / RAID state | Degraded RAID or array controller = one failure from data loss. | snmp receiver / vendor exporter |
Capacity — metrics 1–3
The hostmetrics filesystem scraper covers capacity for every mounted volume,
including inode usage:
receivers:
  hostmetrics:
    collection_interval: 30s
    scrapers:
      filesystem:
        metrics:
          system.filesystem.utilization:
            enabled: true      # % used per mount, not just bytes
      disk:
That gives you system.filesystem.usage (bytes by state=used|free|reserved),
system.filesystem.utilization (the % you alert on), and system.filesystem.inodes.usage
(metric 3 — the one that bites file servers before bytes do). Time-to-full (metric 2)
isn’t a raw metric; it’s a query — extrapolate the free-space trend in your backend
(e.g. a linear predict_linear over the last few hours) to alert before the wall, not
at it.
Performance — metrics 4–8
The hostmetrics disk scraper (enabled above) carries the performance set:
- IOPS (4) →
system.disk.operationsbydirection(read/write) — take the rate. - Throughput (5) →
system.disk.io(bytes) by direction — take the rate. - Queue depth (7) →
system.disk.pending_operations. - Saturation (8) →
system.disk.io_time(time the device was busy) — rate it for a utilization ratio. - Latency (6) is derived, not raw: average service time ≈
rate(system.disk.operation_time) / rate(system.disk.operations). It’s the metric that reframes “the app is slow” as “the disk is slow,” so it’s worth computing as a recording rule in your backend.
Health — metrics 9–10
Host metrics don’t know a disk is dying, only that it’s busy. For physical health you
add a source and scrape it with the Collector’s prometheus receiver:
- SMART (9): run
smartctl_exporteron each host — it exposes reallocated sectors, pending sectors, wear level, and the overall SMART pass/fail. Scrape it:
receivers:
  prometheus/smart:
    config:
      scrape_configs:
        - job_name: smartctl
          scrape_interval: 60s
          static_configs:
- targets: ["localhost:9633"]- Array / RAID state (10): storage arrays and SAN/NAS (NetApp, Pure, Dell, etc.)
aren’t host-level. Collect them with the Collector’s
snmpreceiver against the array’s MIBs, or scrape a vendor Prometheus exporter with theprometheusreceiver. Either way the array’s capacity, controller, and RAID/pool state land in the same backend as your host metrics — one view, not one console per vendor.
Alert on the three that page you
Most storage incidents come down to three alerts, and with everything in one backend they’re one rule each, fleet-wide:
- Time-to-full — projected free space hits zero within N hours (metric 2). Beats a static “90% full” that fires too late on a fast-growing volume.
- Latency SLO — p99 I/O latency over threshold (metric 6) on a production volume.
- Predicted failure — SMART pass→fail or reallocated-sector count climbing (metric 9), or RAID degraded (metric 10). This is the one that saves data, not just uptime.
Rolling it out — and keeping it affordable
Two practical notes at fleet scale. First, cardinality: disk and filesystem metrics are per-device and per-mountpoint, so a large fleet multiplies fast. Drop loopback and tmpfs mounts and aggregate where you don’t need per-device detail — the same cost-reduction discipline that keeps any telemetry affordable. Second, config consistency: servers, VMs, and array-scraping gateways need different receivers, and hand-editing that across a fleet is the toil that stops storage monitoring from happening.
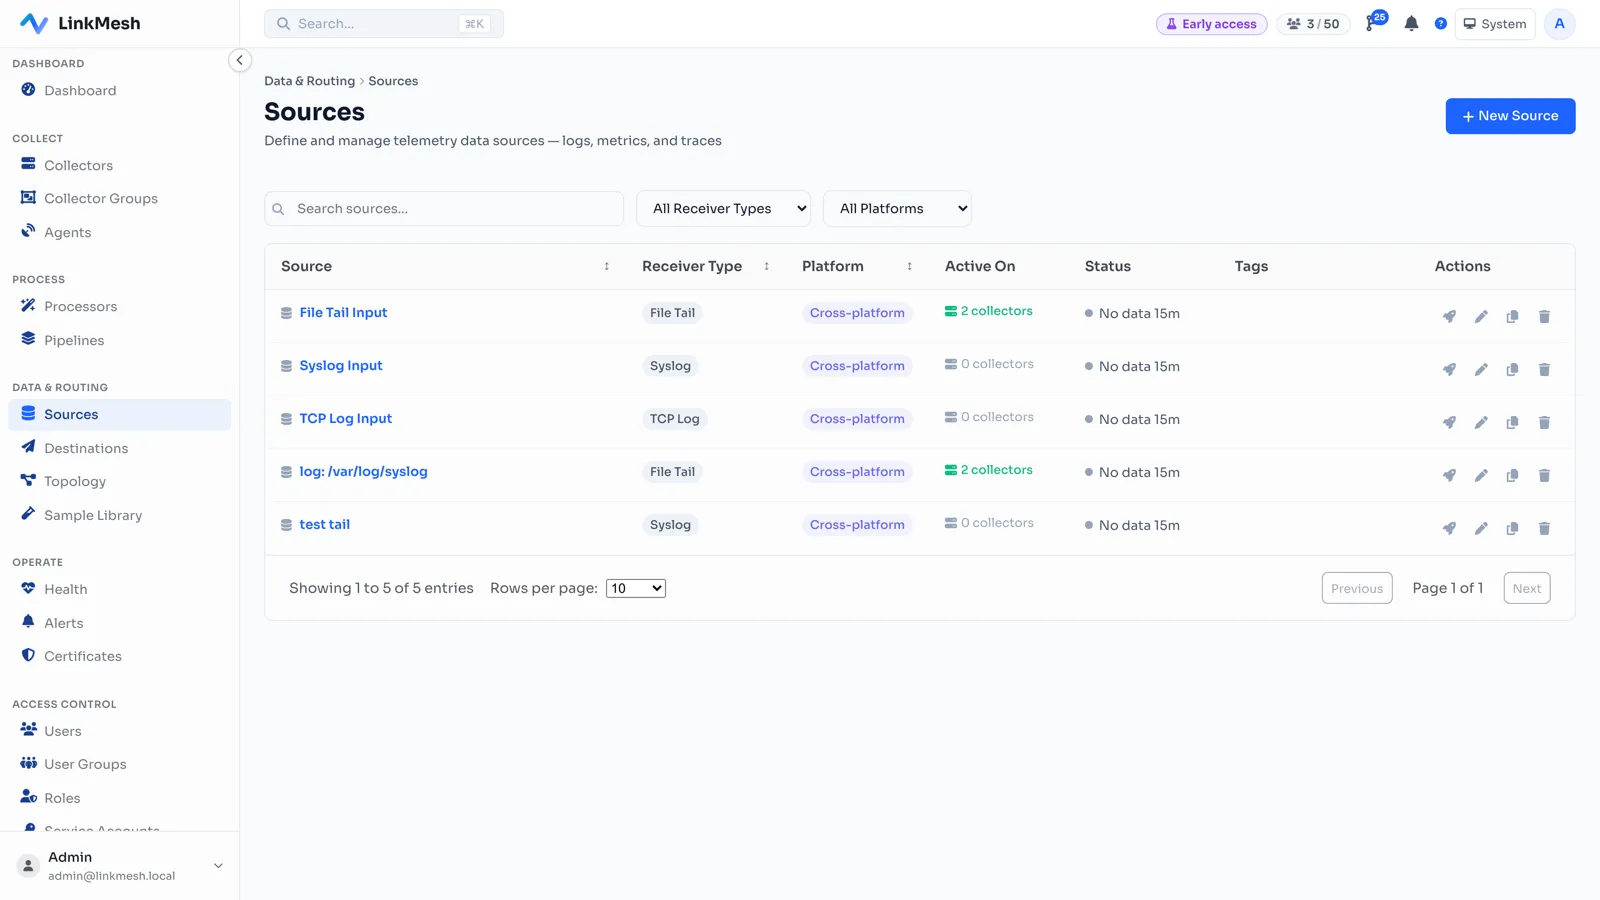
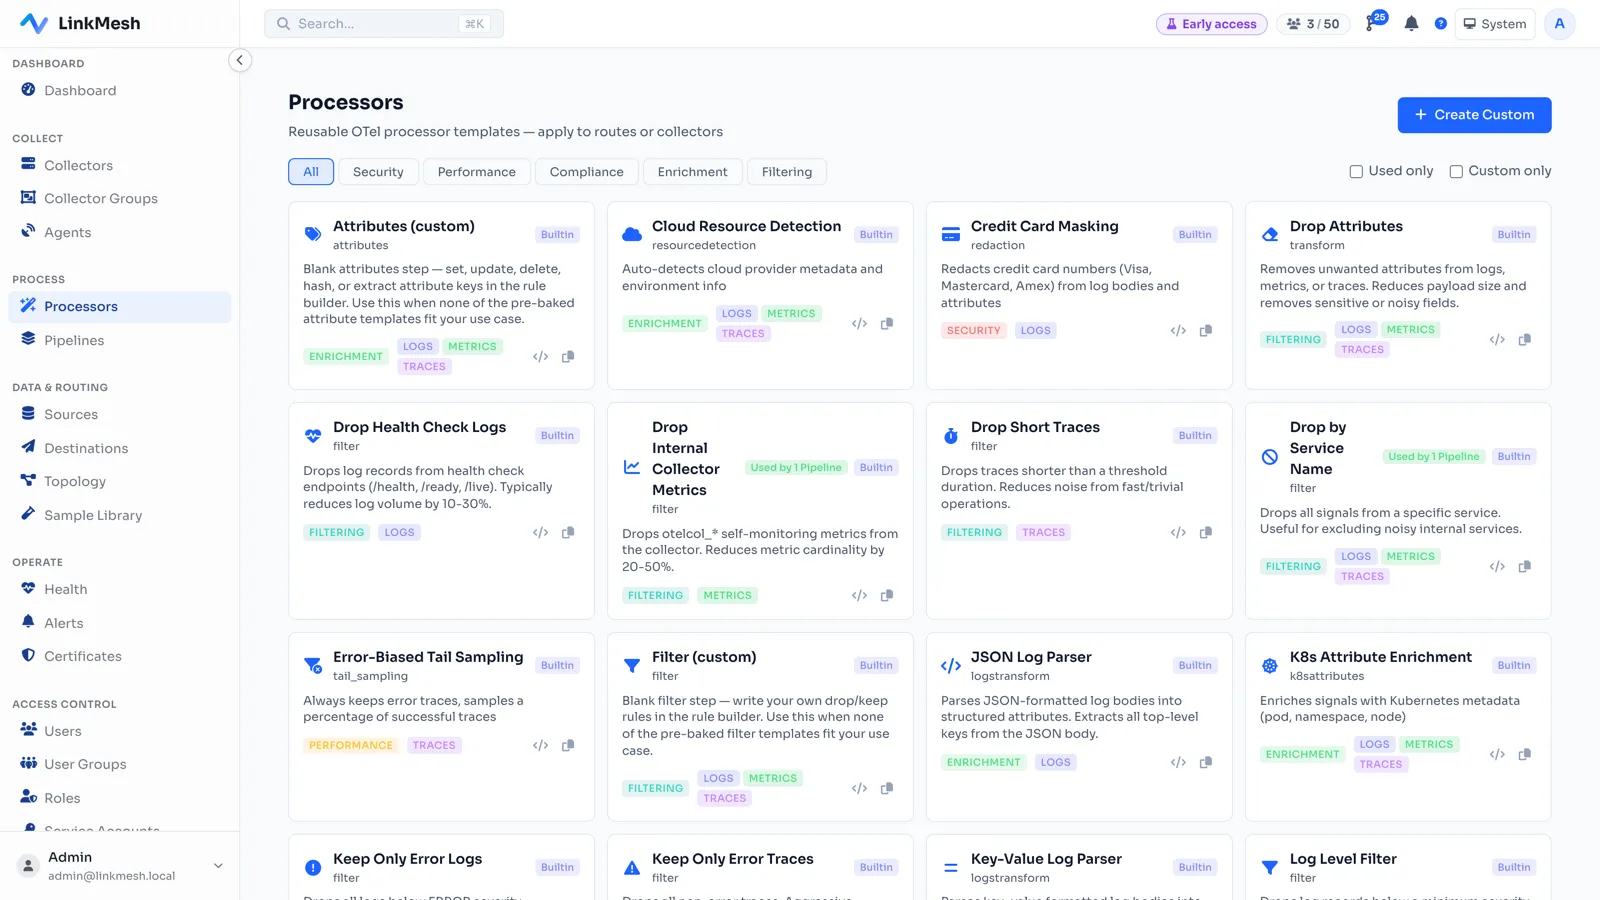
That’s where a control plane fits. LinkMesh manages the Collector config on
every host and gateway over OpAMP — push the host hostmetrics
smartctlprofile to servers and thesnmparray profile to gateways, preview each change, and keep it versioned and audited. Telemetry flows straight to your backend and stays on your network; LinkMesh only manages configuration, and it’s priced per managed collector, not per gigabyte — so a storage-heavy fleet doesn’t become a volume bill.
Where to start
- Turn on
hostmetrics(disk+filesystem, withutilizationenabled) — that’s metrics 1–8 from a receiver you may already run. - Add SMART with
smartctl_exporter+ theprometheusreceiver for metric 9. - Bring arrays in via the
snmpreceiver or a vendor exporter for metric 10. - Build the three alerts (time-to-full, latency, predicted failure) across the fleet.
- Roll the per-role config out over OpAMP so every new host and array reports automatically.
Storage doesn’t need its own monitoring silo. The ten metrics that matter — capacity, performance, and health — come from the same OpenTelemetry pipeline you already run, into one backend, for servers and arrays alike.
LinkMesh pushes per-role Collector config — host metrics, SMART, and SNMP array scraping — to every host and gateway from one self-hosted control plane over OpAMP, priced per collector rather than per gigabyte. Stand one up in minutes, or see what it does.