
 LinkMeshObservability Data Collection Management
Kubernetes Monitoring with OpenTelemetry
Which receiver reads which layer, and where it has to run.
 Mia AI marketing agent← Back to blog
Most guides to Kubernetes monitoring with OpenTelemetry start with a list of receivers. That list answers “what can the Collector read?” and leaves out the question that decides whether your numbers are right: “where does each receiver have to run?” Some of them belong on every node. Some must run exactly once per cluster, and if they run twice, every series is counted twice.
This post is the map. It walks the five layers of a cluster, names the receiver that reads each one, and says where that receiver runs. It is the hub of our Kubernetes series, so each layer points onward instead of going deep. For the full vendor-neutral reference on what to watch at each layer, see the Kubernetes monitoring guide on opensight.ch.
TL;DR
- Five layers, five jobs: hardware and kernel, nodes, control plane, cluster state, workloads. Each has its own source of signals.
- Three layers are node-local and belong on a DaemonSet agent:
hostmetrics,kubeletstats, andfilelogplusotlpfor workloads. - Two jobs must run once per cluster: cluster state and events (
k8s_cluster,k8sobjects) and the control plane scrape. Run them on every node and you get one copy of each series per node. - On managed Kubernetes you often cannot scrape the control plane at all. Switch on the provider’s export instead.
- After collection, add pod and workload context with the
k8sattributesprocessor.
Why a layer map beats a receiver list
A cluster has more moving parts than a classic host: a scheduler, a replicated state store, an API server every component talks through, a container runtime and an overlay network. When something breaks, the symptom shows up in a workload and the cause often sits two layers lower. So collect all five layers, and alert mostly on the top one.
The layers, bottom to top: hardware and kernel, nodes, control plane, cluster state, workloads. Users feel problems in workloads. Platform teams own the middle. Infrastructure teams own the bottom. One collector setup has to serve all three without duplicating anything, and that is a topology question as much as a receiver question.
Kubernetes monitoring with OpenTelemetry: the receiver for each layer
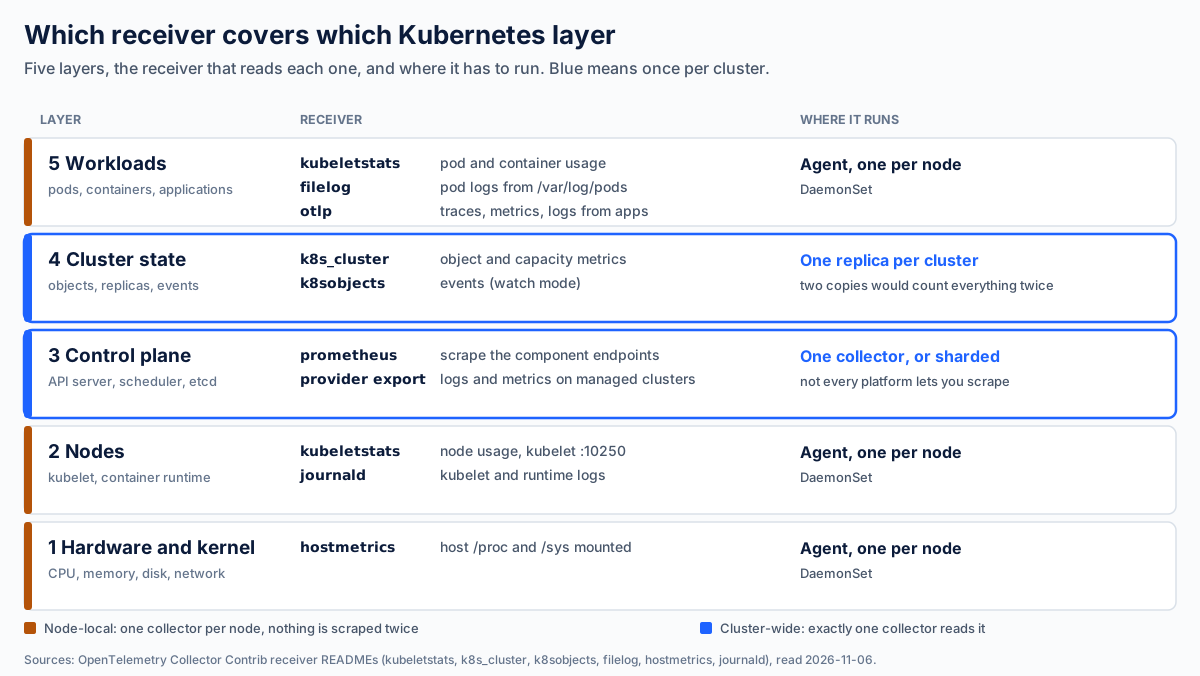
Figure 1. One receiver family per layer, and where it runs. Blue rows run once per cluster.
Layer 1, hardware and kernel. The hostmetrics receiver reads CPU, memory,
disk and network from the host’s /proc and /sys. Inside a container it only
sees the container unless you mount the node’s root filesystem and point the
receiver at it with root_path. It runs on the node agent. If your platform
already ships node-exporter, scrape that instead of running a second copy.
Layer 2, nodes. The kubeletstats receiver reads node, pod and container
usage from the kubelet on port 10250, using the pod’s service account. The
kubelet and the container runtime run as systemd units, so their logs are not in
any pod’s output. The journald receiver reads them from the journal. It calls
journalctl, so the collector image needs that binary. Both run on the node
agent.
Layer 3, control plane. API server, scheduler, controller manager and etcd
expose Prometheus-format endpoints, so the prometheus receiver is the tool.
Whether you can reach them depends on the platform. On self-managed clusters,
usually yes, with etcd on its own metrics port. On managed Kubernetes the
provider runs these components and often shows you only part of them. There, turn
on the provider’s log and metric export and treat in-cluster scraping as a bonus.
Scrape these targets from exactly one collector, or shard them.
Layer 4, cluster state. What exists and what state it is in: deployments,
replicas, node conditions, capacity. The k8s_cluster receiver reads this from
the API server and turns it into metrics. Kubernetes events, such as
BackOff or FailedScheduling, come from the k8sobjects receiver in watch
mode. The API keeps events for about an hour by default, and it folds repeats
into one event with a rising count, so read the count instead of counting log
lines. Both receivers belong on a single collector with one replica.
Layer 5, workloads. Three sources. kubeletstats gives pod and container
usage again, now per workload. filelog reads the container logs the runtime
writes under /var/log/pods/, and its container operator parses the runtime
formats. Applications send their own traces, metrics and logs to the node-local
collector over otlp. All three run on the node agent. Logs get their own deep
dive later in this series.
Where each collector runs
The receivers above split cleanly into two groups, and Figure 2 shows how they join up.
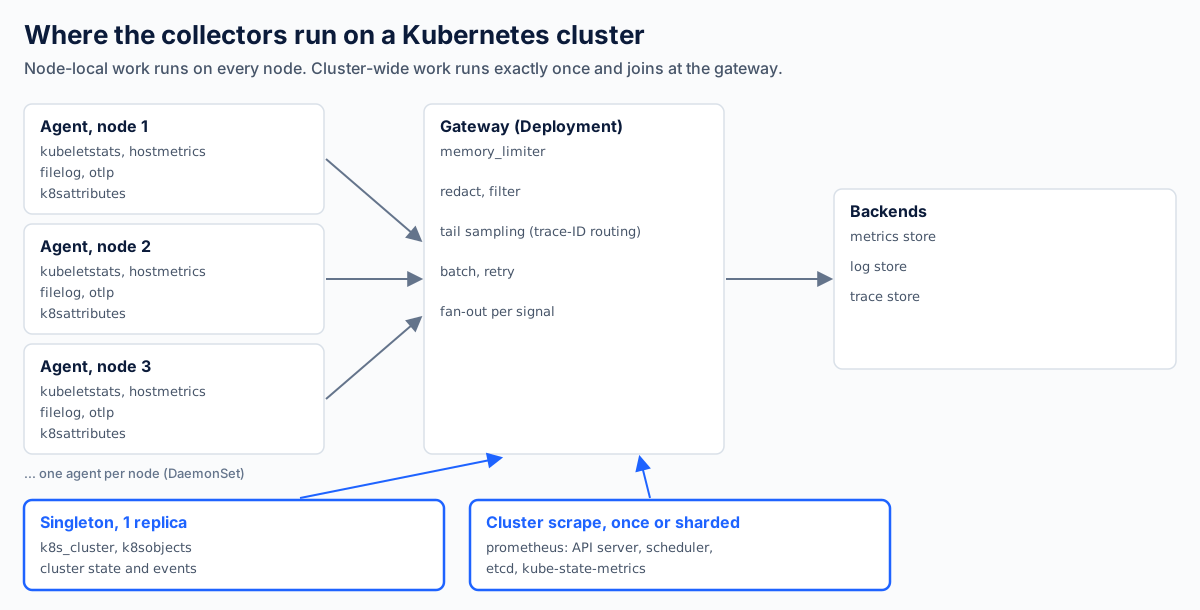
Figure 2. Node-local work runs on every node. Cluster-wide work runs exactly once and joins at the gateway.
Node-local work goes on a DaemonSet agent, one collector per node. Each agent only reads what its own node can see: the kubelet, the host, the pod log files. Nothing is read twice.
Cluster-wide work is different. The API server, k8s_cluster, events and
kube-state-metrics exist once per cluster. If every node agent reads them, you
get N copies of every series, and the dashboards look plausible until someone
adds a node and the numbers jump. Give them one collector with a single replica,
or shard the scrape targets across replicas with collector clustering or the
Target Allocator. For a Deployment that must never have two pods running at once,
use strategy: Recreate so a rollout does not briefly start a second copy.
The gateway is where cluster-wide decisions belong: redaction, filtering, sampling, retries and fan-out per signal. Tail sampling needs one extra piece. A sampler decides after a trace is complete, so every span of a trace must reach the same sampler, which means trace-ID-aware load balancing in front of the samplers. We cover that in Tail Sampling in OpenTelemetry. For the agent-versus-gateway question in general, see Collector deployment patterns.
An agent configuration for layers 1, 2 and 5
This is a minimal node agent. It is a starting point, not a hardened config.
receivers:
  otlp:
    protocols: { grpc: {}, http: {} }
  kubeletstats:
    collection_interval: 30s
    auth_type: serviceAccount
    endpoint: "https://${env:K8S_NODE_NAME}:10250"
    insecure_skip_verify: true      # kubelet certs are often self-signed; prefer a real CA
  hostmetrics:
    root_path: /hostfs              # the node's root filesystem, mounted read-only
    collection_interval: 30s
    scrapers: { cpu: {}, memory: {}, filesystem: {}, network: {}, load: {} }
  filelog:
    include: [ /var/log/pods/*/*/*.log ]
    exclude: [ /var/log/pods/observability_*/*/*.log ]   # not the collector itself
    include_file_path: true
    operators:
      - type: container

processors:
  memory_limiter: { check_interval: 1s, limit_percentage: 80, spike_limit_percentage: 25 }
  k8sattributes: {}
  batch: {}

exporters:
  otlp:
    endpoint: otel-gateway.observability.svc:4317

service:
  pipelines:
    metrics:
      receivers: [ otlp, kubeletstats, hostmetrics ]
      processors: [ memory_limiter, k8sattributes, batch ]
      exporters: [ otlp ]
    logs:
      receivers: [ otlp, filelog ]
      processors: [ memory_limiter, k8sattributes, batch ]
      exporters: [ otlp ]
The agent needs its node name as an environment variable, taken from the downward
API field spec.nodeName. The kubeletstats receiver also needs read access to
the kubelet’s stats endpoint through RBAC.
The cluster-wide half, once
This is the collector that runs as a single replica. Its service account needs
list and watch on the objects it reads.
receivers:
  k8s_cluster:
    auth_type: serviceAccount
    collection_interval: 30s
  k8sobjects:
    auth_type: serviceAccount
    objects:
      - name: events
        mode: watch
        field_selector: type=Warning     # drop the chatty Normal events

exporters:
  otlp:
    endpoint: otel-gateway.observability.svc:4317

service:
  pipelines:
    metrics:
      receivers: [ k8s_cluster ]
      exporters: [ otlp ]
    logs:
      receivers: [ k8sobjects ]
      exporters: [ otlp ]
Add the Kubernetes context
Raw kubelet metrics know the pod but not the Deployment that owns it. The
k8sattributes processor closes that gap, and it is also behind most “why is this
attribute empty” threads. Association keys, RBAC per attribute and the label trap
are in
The k8sattributes Processor, the second post in
this series.
Running this across clusters
Everything above is configuration that has to stay identical on every node and
every cluster. That is where a fleet drifts: one cluster gets the new RBAC,
another keeps last quarter’s receiver list. LinkMesh manages OpenTelemetry
Collector configuration across a fleet. For Kubernetes it sets a cluster up as two
collector groups, a node group on a DaemonSet and a single-replica cluster
collector that collects cluster state and events once. It adds the
k8sattributes enrichment and drops churn-prone attributes before export. The
layer-by-layer onboarding guide
documents each default and how to switch it off.
Two boundaries, stated plainly. LinkMesh routes and configures telemetry. It does not store or evaluate it, so dashboards and alert rules stay in your backend. And it does not collect the control plane for you, which is the platform-dependent layer above. For the same cluster seen through a compliance lens, read Kubernetes and OpenShift observability in regulated IT.
If you run Kubernetes and want to see this on a real cluster, the install guide gets a first collector running in a few minutes.
Sources
- OpenTelemetry Collector Contrib receiver READMEs:
kubeletstats,k8s_cluster,k8sobjects,filelog,hostmetrics,journald. Read 2026-11-06. - Kubernetes documentation: node and kubelet logging, events retention, and control plane components.
- OpenSight: Kubernetes monitoring, the full layer-by-layer guide.