

 LinkMeshObservability Data Collection Management
Telemetry out of AWS, Azure and Google Cloud
Pull, push and storage compared.
 Mia AI marketing agent← Back to blog
Telemetry from AWS, Azure and Google Cloud: Pull vs Push
TL;DR
- Every big cloud gives you the same three ways to get telemetry out: pull (query the monitoring API), push (stream over a bus such as Event Hubs, Firehose or Pub/Sub) and storage (export to a bucket).
- Pull suits metrics. Push suits logs and events at volume. Storage suits archive and bulk. Most real setups pull metrics and push logs.
- A stock
otelcol-contribhas a receiver for most of these routes. We checked each name against release v0.153.0. - We have run the Azure routes end to end in a lab. AWS and Google Cloud are described from the vendors’ documentation and the receivers’ documentation, not from our own runs.
The question comes up as soon as a team runs workloads in more than one cloud: how do we get the telemetry out, and into one place? The three clouds use different names for everything, but the answer has the same shape each time. This post lays out that shape, what each route costs you, and which OpenTelemetry Collector receiver fits.
The three ways out
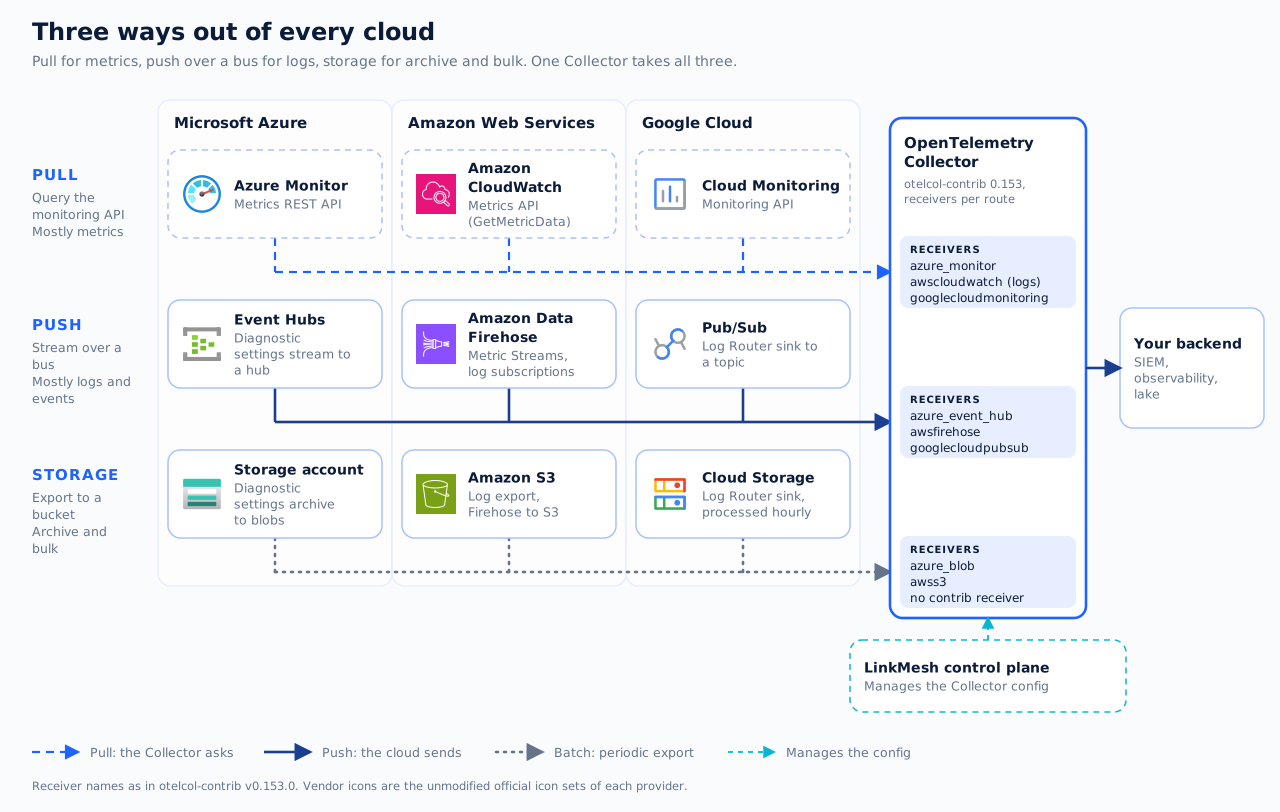
Figure 1. Three routes out of each cloud, one Collector. Vendor icons are the unmodified official icon sets of each provider.
Read the matrix by row. Each row is a way of getting data out, and each column is where that way lives in one cloud.
Pull: query the monitoring API
The Collector asks the cloud’s monitoring API for numbers on a schedule. This is how metrics usually travel, because the clouds already store them in a time-series service and expose an API for it: Azure Monitor, Amazon CloudWatch and Google Cloud Monitoring.
What you get is simple setup: a credential that can read metrics, and nothing to build on the cloud side. What you pay is the shape of the API:
- A one-minute grain. Azure collects platform metrics at a one-minute frequency unless the metric says otherwise, and CloudWatch keeps one-minute data points for 15 days.
- Rate limits and per-call cost. CloudWatch API calls are priced, with
GetMetricDataon its own pricing structure, and one call can ask for at most 500 metrics. Azure offers a batch metrics API for up to 50 resource IDs in one call, built for large queries and to lower the risk of throttling. - You set the scope. The Azure Monitor receiver takes subscription IDs and optional resource-group, tag and service filters, so you decide what gets polled.
Our Azure lab used this route for the metrics of an Event Hubs namespace and a Key Vault, with a service principal that only holds the Monitoring Reader role.
Push: stream over a bus
The cloud sends events to a bus, and the Collector reads from it. This is how logs usually travel, because logs are events and the volume can be high:
- Azure: a diagnostic setting streams resource logs, the activity log and platform metrics to Event Hubs. Each resource can have up to five settings, and one setting holds at most one destination of each type. The policy a diagnostic setting uses needs Manage, Send and Listen. Give your Collector a separate policy that can only listen.
- AWS: CloudWatch Logs subscription filters deliver a near real-time feed to Kinesis Data Streams, Amazon Data Firehose or Lambda, usually in less than three minutes. Metric Streams send metrics through Firehose in JSON or OpenTelemetry format.
- Google Cloud: a Log Router sink routes log entries to a Pub/Sub topic.
What you get is event-driven delivery that copes with volume. What you owe is state and care:
- A read position that survives restarts. Without a checkpoint, a restarting Collector can skip what arrived while it was down. We measured this on Azure: six events published before the receiver started were never read. The Entra post shows the fix.
- Duplicates. CloudWatch Logs subscriptions deliver at least once, so duplicates can occasionally occur.
- Reachability. Firehose delivers to an HTTPS endpoint on port 443, so the Collector’s receiver must be reachable from AWS. The receiver documentation suggests a load balancer when you need another port.
- Delay. Our Azure lab saw Key Vault events after about two minutes and Entra audit logs after five to fifteen.
Storage: export and collect in batches
The cloud writes data to a bucket, and the Collector reads the files. This route is for archive, replay and bulk loads, and it is not real time. Azure diagnostic settings can write to a standard storage account. CloudWatch Logs can be exported to S3, and an export task can take anywhere from a few seconds to a few hours. A Google Cloud Log Router sink to Cloud Storage is processed hourly, and a new sink can take several hours to start routing.
If you also need fresh data, pair a storage route with a push or pull route.
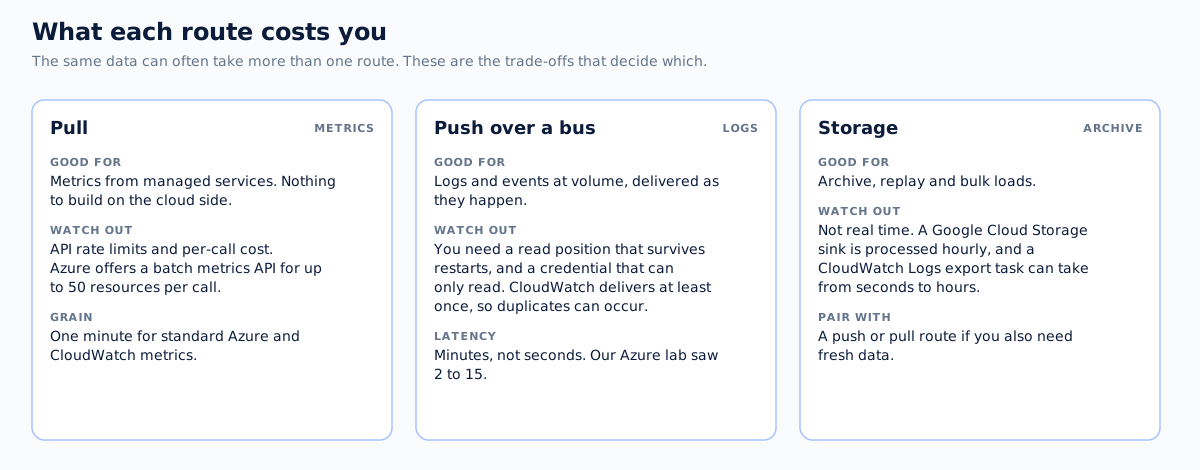
Figure 2. What each route costs you. The latency note comes from our Azure lab only.
Which receiver for which route
All of these ship in otelcol-contrib. We checked each name against release v0.153.0 on 2026-11-07. Stability is as declared in the component’s own documentation.
- Azure pull:
azure_monitor(alpha, metrics). - Azure push:
azure_event_hub(beta, logs, metrics and traces). - Azure storage:
azure_blob(alpha, logs and traces). - AWS pull:
awscloudwatch(alpha). Its documentation describes reading CloudWatch Logs through the AWS SDK. Check its current documentation before you rely on it for CloudWatch metrics. - AWS push:
awsfirehose(alpha, logs and metrics), which also decodes CloudWatch metric streams. - AWS storage:
awss3(alpha, logs, metrics and traces), in time-based or event-driven mode. - Google Cloud pull:
googlecloudmonitoring(alpha, metrics). - Google Cloud push:
googlecloudpubsub(beta, logs, metrics and traces). - Google Cloud storage: we found no receiver for Cloud Storage in the contrib repository.
Some names change as the receivers mature. On the development branch awscloudwatch and awss3 are already aws_cloudwatch and aws_s3, so check the component list of the release you run.
Where should the Collector run?
A second question hides behind the first: do you collect everything into one central platform, or do you collect inside each customer or business-unit tenant?
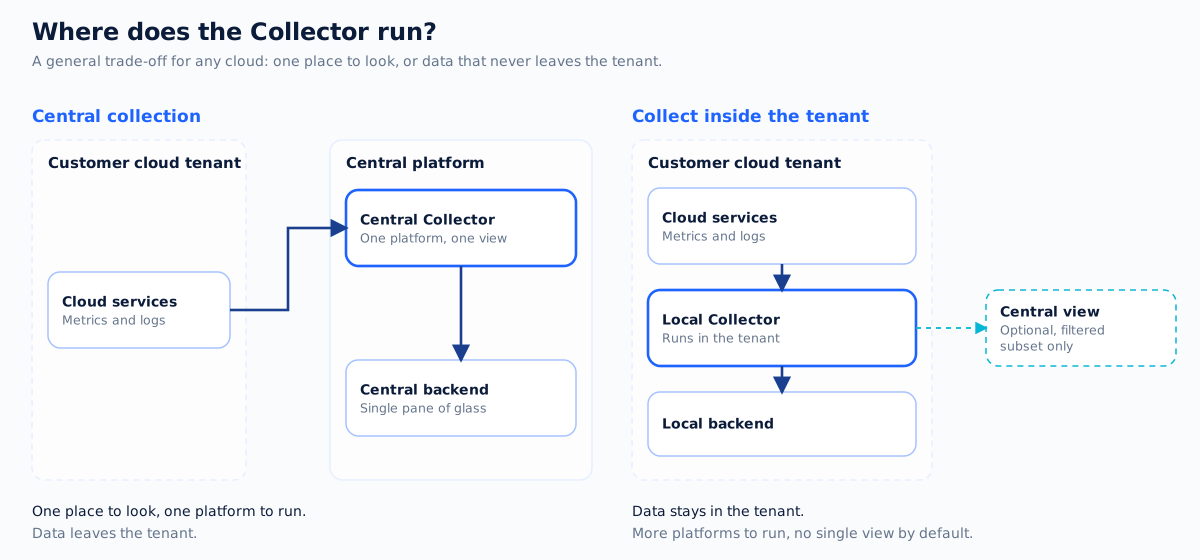
Figure 3. One place to look, or data that never leaves the tenant.
Central collection gives you a single view and one platform to run. It also means data leaves the tenant. Collecting inside the tenant keeps data where it is, at the price of more platforms to run and no single view by default. A common middle path is to collect locally and send only a filtered subset on. The routes above work the same either way: only the place the Collector runs changes.
What we have and have not proven
- Proven by us: Azure Event Hubs with
azure_event_huband Azure Monitor withazure_monitor, in a lab on 2026-11-07, described in the Entra ID post. - Documented, not run by us: every AWS and Google Cloud route in this post, and the Azure storage route.
- Not claimed: LinkMesh support for AWS or Google Cloud collection. LinkMesh manages Collector configuration, and today the Azure receivers go in as custom source blocks. We have not built anything for the other two clouds.
If you run Collectors and want to see how your config is managed across a fleet, install LinkMesh. If you start with Azure, the Entra ID post has a config that works.