
 LinkMeshObservability Data Collection Management
Proxmox VE → Grafana
Nodes, guests, storage, and Ceph — one collector per node. Self-hosted or Grafana Cloud.
 Roman Hüsler← Back to blog
Proxmox VE already shows you everything — per node. The summary graphs, the task log, the Ceph dashboard: it’s all there in the web UI. The problem starts when you run a cluster: the built-in RRD graphs live on each node with fixed retention, there’s no alerting on “storage 90% full” out of the box, and correlating “VM 104 got slow” with “OSD 7 started flapping” means four browser tabs and a guess.
The OpenTelemetry Collector runs as a normal systemd service on each Proxmox node — it’s Debian underneath, after all. And since Proxmox VE 9.0, the platform meets you halfway: a native OpenTelemetry metric-server plugin pushes node, guest, and storage metrics via OTLP/HTTP to your collector — the same data that feeds the built-in graphs, now with real retention, alerting, and one dashboard for the whole cluster. The Collector and all collection logic run on your nodes; pair it with a self-hosted Prometheus and Loki and telemetry never leaves your network, or point it at Grafana Cloud’s OTLP endpoint if you’d rather not run the backend. Either way: no SaaS agent inside your infrastructure, no per-node licence.
Admins running Proxmox VE — a homelab node, a three-node cluster, or a rack of them — who live in the PVE web UI and want history, alerting, and a single Grafana view across nodes, guests, storage, and Ceph. You need root on the nodes and a Grafana target (self-hosted Grafana + Prometheus/Loki, or Grafana Cloud’s free tier).
What you’ll have when you’re done
- Every node’s CPU, memory (including ZFS ARC), IO delay, and network in one Grafana dashboard, with real retention — not the fixed RRD windows of the node UI.
- Per-guest metrics for every VM and container — CPU, memory, disk, network, running/stopped — pushed by Proxmox itself, no agent inside the guests.
- Storage usage per store (local-lvm, ZFS, NFS, Ceph pools) with time-to-full trends, plus Ceph health and cluster state if you run hyper-converged.
- The journal of every node searchable in one place —
pvedaemon,corosync, the HA stack, and backup-related daemon messages — instead of SSH-ing around withjournalctl. - One systemd service per node doing all of it, plus a ready-made dashboard.
How it maps to what you already use
Nothing here is a new concept — it’s the Proxmox tooling you know, pointed at Grafana:
| You know it as… | OpenTelemetry gets it via… | In the config it’s called |
|---|---|---|
| Node / guest summary graphs | Proxmox VE’s native OTLP push (PVE 9.0+) | otlp receiver |
htop, zpool status, IO delay |
the host-metrics collector | hostmetrics |
journalctl on each node |
the journald reader | journald |
Ceph dashboard / ceph -s |
the Ceph manager’s metrics endpoint | prometheus receiver |
| External metric server (InfluxDB/Graphite) | the destination it sends to | exporters |
Step 1 — Install a pinned Collector release on each node
Proxmox VE is Debian, so the Collector installs like any other package. Pick a tested
version from the official
releases
— the release assets carry the version in the filename, so there is no stable
“latest” download URL, and pinning a version you’ve tested beats installing whatever
shipped last night anyway. The example below uses 0.157.0; substitute the version
you chose:
OTEL_VERSION="0.157.0"

wget "https://github.com/open-telemetry/opentelemetry-collector-releases/releases/download/v${OTEL_VERSION}/otelcol-contrib_${OTEL_VERSION}_linux_amd64.deb"

dpkg -i "otelcol-contrib_${OTEL_VERSION}_linux_amd64.deb"
(You want the contrib build — the journald reader ships there.)
The package registers a systemd service (otelcol-contrib) that runs as its own
unprivileged user, also named otelcol-contrib — that detail matters in Step 4. The
configuration lives at /etc/otelcol-contrib/config.yaml; that’s the one file
you’ll edit next.
Step 2 — Choose your backend: Grafana Cloud or self-hosted
Grafana Cloud (free tier is enough to start): go to Connections → OTLP →
“Send data” and copy the two things it shows you — the OTLP endpoint (looks
like https://otlp-gateway-<zone>.grafana.net/otlp) and the Authorization header
(a Basic ... token Grafana generates for you). Note that with this path your
telemetry is exported over TLS to Grafana’s cloud; the collection itself still runs
entirely on your nodes.
Self-hosted Prometheus + Loki — the natural choice for a Proxmox shop, and the path where telemetry truly never leaves your network. Two things to switch on:
- Prometheus must be started with
--web.enable-otlp-receiverto accept OTLP; its ingest path is/api/v1/otlp/v1/metrics. - Loki 3.x accepts OTLP natively under
/otlp(on older 2.9-era versions, structured metadata must be enabled first).
The matching exporter block, which replaces the single otlphttp/grafana exporter
used in Step 3:
exporters:
  otlphttp/prometheus:
    metrics_endpoint: "http://prometheus.example.net:9090/api/v1/otlp/v1/metrics"
  otlphttp/loki:
    endpoint: "http://loki.example.net:3100/otlp"

service:
  pipelines:
    metrics: { ..., exporters: [otlphttp/prometheus] }
    logs:    { ..., exporters: [otlphttp/loki] }
Both variants are included (commented) in the download below, so you only ever uncomment one of them.
Step 3 — Configure the Collector: node metrics, journal, Ceph
You do not need to write this configuration from scratch. Download the ready-made
file, drop in your backend values from Step 2, and save it over
/etc/otelcol-contrib/config.yaml:
⬇ Download the ready-to-use Proxmox VE config (config.yaml)
Here’s what it contains, in plain terms — each block maps to something you already recognise:
receivers:
  otlp:                    # receives Proxmox VE's native metric push (Step 5)
    protocols:
      http:
        endpoint: 127.0.0.1:4318   # loopback — Proxmox pushes from the same node

  hostmetrics:             # htop-style node values: CPU, memory, disks, network
    collection_interval: 30s
    scrapers:
      cpu: {}
      memory: {}
      load: {}
      disk: {}
      filesystem: {}
      network: {}
      paging: {}

  journald:                # the same journal you'd read with journalctl
    units:
      - pvedaemon
      - pveproxy
      - pvestatd
      - pve-cluster
      - pve-ha-lrm
      - pve-ha-crm
      - corosync
    priority: info

processors:
  memory_limiter:          # keeps the collector from eating the hypervisor's RAM
    check_interval: 1s
    limit_mib: 256
    spike_limit_mib: 64
  resourcedetection/system:  # stamps host.name on everything → host_name in Grafana
    detectors: [system]
    system:
      hostname_sources: [os]
  batch: {}

exporters:
  otlphttp/grafana:        # Grafana Cloud — or swap for the self-hosted pair (Step 2)
    endpoint: "https://otlp-gateway-<zone>.grafana.net/otlp"
    headers:
      Authorization: "Basic <base64 of instanceID:token>"

service:
  pipelines:
    metrics:
      receivers: [otlp, hostmetrics]
      processors: [memory_limiter, resourcedetection/system, batch]
      exporters: [otlphttp/grafana]
    logs:
      receivers: [journald]
      processors: [memory_limiter, resourcedetection/system, batch]
exporters: [otlphttp/grafana]otlp— the open door Proxmox pushes its own metrics through (Step 5). It binds to loopback on purpose: in this setup every node runs its own collector, so nothing needs to listen on the network. (Sending from a remote node to a central collector instead? Bind0.0.0.0:4318, open TCP 4318 in the Proxmox firewall, and put TLS on it.)hostmetrics— the node basics, with history. This is also where IO delay lives — the number every Proxmox admin watches first.journald— cluster, HA, and daemon activity. Backup-wise, this captures the backup-related daemon messages (vzdumpruns invoked throughpvedaemon) — the full per-task output stays in Proxmox’s task logs under/var/log/pve/tasksand is not collected by this config.resourcedetection/system— stampshost.nameon every metric and log line, which is what becomes thehost_namelabel you’ll filter by in Grafana. Without it, the queries and the dashboard below have nothing to group on.memory_limiter+batch— production hygiene: a hard memory cap and batched exports, in that order, in every pipeline.
Ceph — only where a manager runs
Ceph’s metrics come from the manager’s prometheus module, not from every node.
Enable the module once, cluster-wide:
ceph mgr module enable prometheusThen scrape it only on nodes running ceph-mgr — or, simpler to operate, list
all manager addresses on one collector and let it follow the active one (standby
managers respond with an empty page, so scraping all of them is safe):
receivers:
  prometheus/ceph:
    config:
      scrape_configs:
        - job_name: ceph
          scrape_interval: 15s     # matches the mgr module's default cache interval
          honor_labels: true
          static_configs:
            - targets:
                - "pve1.example.net:9283"
                - "pve2.example.net:9283"
                - "pve3.example.net:9283"
Add prometheus/ceph to the metrics pipeline’s receivers list on that collector.
Do not paste localhost:9283 onto every node blindly — on nodes without a
manager there’s nothing listening there. And a scope note: the mgr module carries
health, capacity, and cluster state, which is what you alert on; recent Ceph
releases moved detailed per-daemon performance counters to the separate
ceph-exporter, so this is deliberately not “every Ceph metric that exists”.
Step 4 — Let the collector read the journal
The DEB runs the collector as the unprivileged otelcol-contrib user — which, out
of the box, is not allowed to read the system journal. Grant it membership in
the systemd-journal group:
usermod -aG systemd-journal otelcol-contrib
systemctl restart otelcol-contrib
And prove it worked, as the service user:
sudo -u otelcol-contrib journalctl -u pvedaemon -n 5If that prints five journal lines, the collector can read them too. (Resist the temptation to just run the service as root — the group is all it needs.)
Step 5 — Turn on Proxmox VE’s native OpenTelemetry push
This is the step that makes it Proxmox monitoring rather than generic Linux
monitoring. Since Proxmox VE 9.0, the platform ships an OpenTelemetry
metric-server plugin next to the long-standing InfluxDB and Graphite options. It
pushes the status data pvestatd already collects — per-node, per-guest
(VM and container), and per-storage metrics — via OTLP/HTTP to your collector.
In the web UI: Datacenter → Metric Server → Add → OpenTelemetry, and point it at
the collector on the node itself: http://localhost:4318. Because the metric server
is a datacenter-level setting, you configure it once and every node in the cluster
pushes to its local collector.
Two options until you upgrade. Installations with pve-manager 8.2.5 or
newer expose /cluster/metrics/export for pull-style collection — verify
the endpoint responds on your nodes before relying on it. Or run the community
prometheus-pve-exporter (read-only API token with the PVEAuditor role)
and scrape it with the same prometheus receiver used for Ceph above —
the rest of this guide is unchanged.
Step 6 — Validate, then verify
Always validate before restarting — a typo found by the validator is a typo that never takes your telemetry down:
otelcol-contrib validate --config /etc/otelcol-contrib/config.yaml
systemctl restart otelcol-contrib
systemctl status otelcol-contrib
Then check the data end-to-end:
- Open Grafana → Explore, pick your metrics data source, and filter on
host_name— with theresourcedetectionprocessor from Step 3, every node reports under its hostname. Host metrics appear within a minute; the Proxmox guest and storage metrics follow with the nextpvestatdpush cycle. - Switch the data source to Loki and query
{host_name="pve1"}— the node’s journal is now searchable. (Nohost_namelabel? Check thatresourcedetection/systemis listed in the logs pipeline; the label only exists because that processor puts it there.)
That’s the whole loop: one service per node, one datacenter setting, and the cluster is reporting to Grafana.
Step 7 — Import the dashboard and wire the alerts
Rather than build panels by hand, import the ready-made starter dashboard, then pick your node from the Node dropdown at the top:
⬇ Download the Proxmox VE dashboard (Grafana JSON)
In Grafana: Dashboards → New → Import → Upload JSON file, then choose your Prometheus and Loki data sources when prompted. It ships panels for CPU busy %, IO delay, memory, storage usage per filesystem, network throughput, a node-reporting status tile, Ceph health, backup-related journal errors, and a searchable journal panel. The host-metric panels work as-is with the config above.
One honest caveat on the Proxmox-native metrics: the OTLP push names them with
proxmox_-style prefixes (counters gaining a _total suffix in Prometheus), but the
exact names can evolve between PVE releases — verify them in Grafana Explore
against your version before wiring alerts to them. The shapes you’re looking for:
# Node CPU as reported by Proxmox itself
proxmox_node_cpu

# Storage fill ratio, per storage — the alert that prevents most Proxmox outages
proxmox_storage_used_bytes / proxmox_storage_total_bytes

# Ceph: anything other than 0 deserves a page
ceph_health_status
Then wire the alerts. Start with these — they cover most Proxmox incidents we see:
| Alert | Signal | Why |
|---|---|---|
| Storage > 85% used | per-storage usage metric | Full storage = guests pause or go read-only. Trend it — time-to-full beats a threshold. |
| IO delay sustained > 10% | hostmetrics CPU wait state |
The classic “everything is slow” cause on hyper-converged nodes. |
| Node memory > 90% incl. ARC | hostmetrics memory |
ZFS ARC + KSM make memory pressure easy to misread in the UI. |
| Guest down that should be up | Proxmox guest status metric | Catches crashed VMs the HA stack doesn’t manage. |
| Ceph health ≠ OK / OSD down | Ceph mgr metrics | Degraded is one failure away from data loss. |
| Backup-related errors in the journal | vzdump/pvedaemon messages |
An early warning — for guaranteed job-level alerting, also enable Proxmox’s own notification system; full task logs stay in /var/log/pve/tasks. |
| Quorum lost / corosync flapping | journal (corosync) |
Precedes fencing events; a flapping link is a warning shot. |
Optional — Manage a Proxmox Collector fleet with LinkMesh
The setup above is complete — everything from here is about running it at scale. One node is a file you edit; three clusters across two sites, plus the backup host, is a fleet, and hand-editing YAML on every node is exactly the toil that made you tolerate the RRD graphs this long.
OpenTelemetry’s answer to fleet management is OpAMP: a
small supervisor process runs next to the Collector and manages its configuration —
a bare otelcol-contrib alone doesn’t phone anywhere. LinkMesh ships
exactly that pairing, as a self-hosted control plane — which matters here,
because nobody running Proxmox on-prem wants their infrastructure telemetry managed
from someone else’s cloud. Once the setup works on one node, enroll each node’s
collector with a token and LinkMesh distributes and versions the tested
configuration across the fleet — every change previewed, versioned, and audited,
and the telemetry itself still flows straight from each node to your backend.
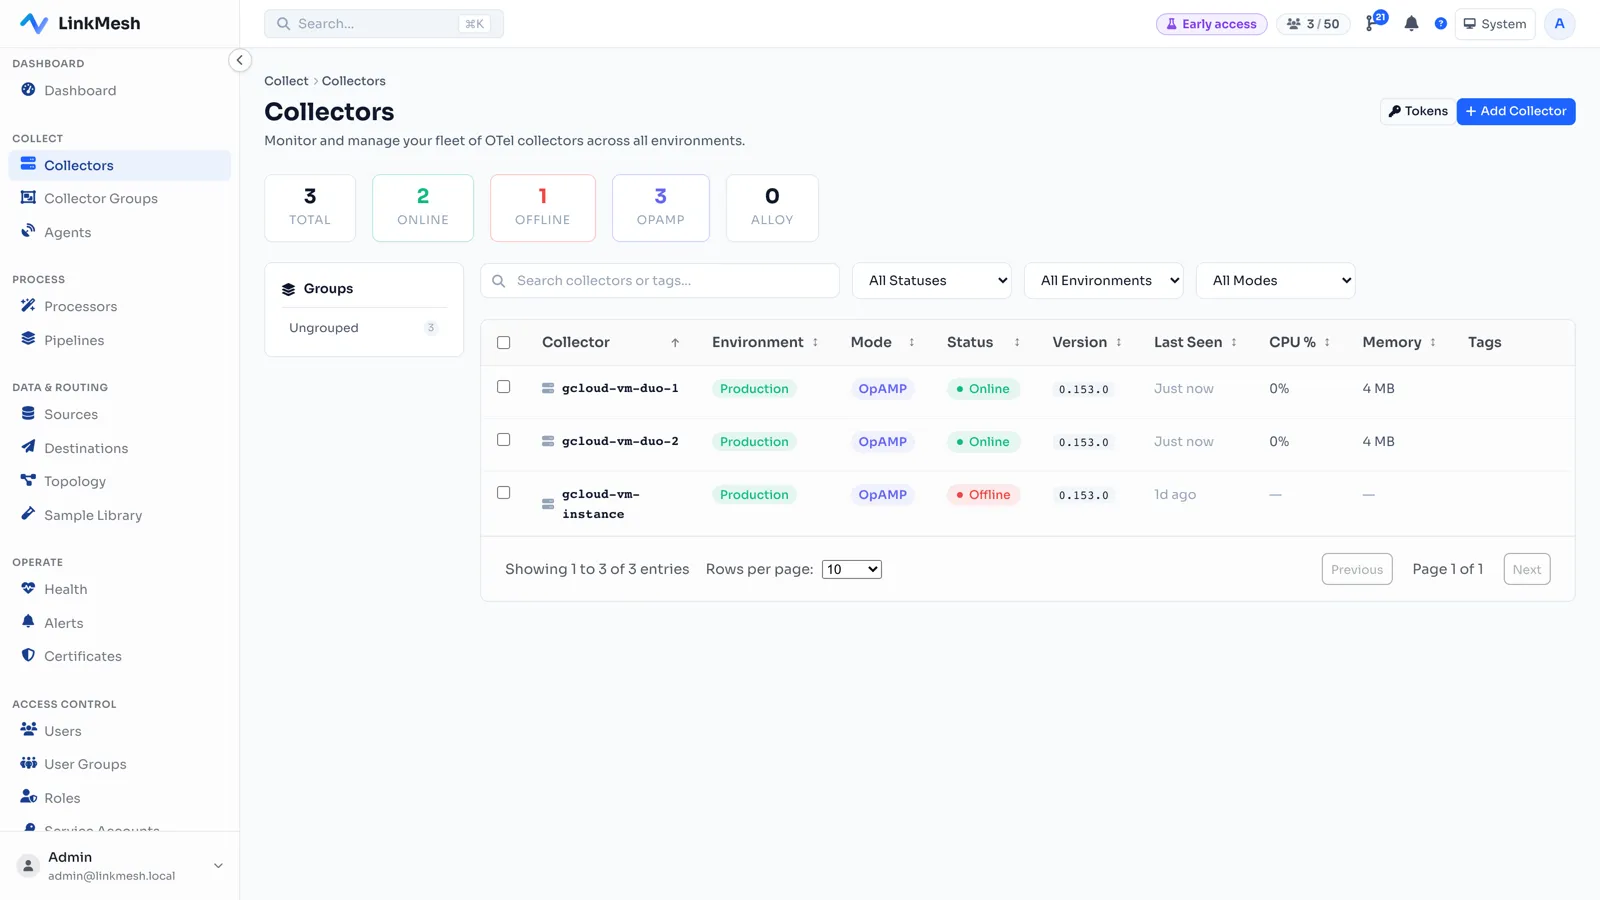
It’s priced per managed collector, not per gigabyte, so a chatty cluster journal doesn’t turn into a volume bill — and at fleet scale it’s also the place to keep every node’s config from drifting after that one 2 a.m. hotfix.
Troubleshooting
- Service won’t stay running — run
otelcol-contrib validate --config /etc/otelcol-contrib/config.yaml; it prints the exact YAML error. - Proxmox metric server shows errors — check the collector is listening:
ss -ltnp | grep 4318. If a node pushes to a remote collector, the receiver must bind0.0.0.0:4318(not loopback) and TCP 4318 must be open in the Proxmox firewall — and add TLS before sending across the network. - No journal entries in Loki — the
otelcol-contribuser must be in thesystemd-journalgroup (Step 4). Test exactly what the service can see:sudo -u otelcol-contrib journalctl -n 5. - No
host_namelabel — theresourcedetection/systemprocessor must be listed in both pipelines; the label only exists because it’s added there. - No Ceph metrics — the module must be enabled (
ceph mgr module enable prometheus) and the scrape must target a manager node; confirm withcurl <mgr-host>:9283/metrics. Standby managers legitimately return an empty page — scrape all of them and the active one delivers. - Guest metrics missing, node metrics fine — the native push exists since
PVE 9.0; on 8.x use
prometheus-pve-exporteras described in Step 5.
Proxmox VE gives you the hypervisor; it never promised you the observability stack. One package, one config file, one datacenter setting — and the whole cluster reports to Grafana, on your terms, on your network.
LinkMesh manages the Collector on every node from one self-hosted control plane — edit once, preview, and deploy over OpAMP with versioned, audited rollouts, priced per collector rather than per gigabyte. Stand one up in minutes, or see what it does.