
 LinkMeshObservability Data Collection Management
Collector Deployment Patterns
Agent, sidecar, gateway, hybrid — and when each one fits.
 Roman Hüsler← Back to blog
“Deploy a collector” is deceptively vague. An OpenTelemetry Collector is the same binary whether it runs one-per-host, one-per-pod, or as a central cluster — but where you run it changes what it’s good at, what it costs, and what fails when it breaks. Pick the wrong pattern and you’ll either starve your workloads of CPU or funnel your whole estate’s telemetry through a single point of failure.
This guide lays out the concrete deployment patterns, when each one fits, and the Kubernetes specifics that make some of them easy. It’s the practical companion to the enterprise architecture overview — that post explains why the agent-and-gateway shape exists; this one is how you actually deploy the collectors.
Platform engineers and SREs deciding how to deploy OpenTelemetry Collectors — on VMs, in Kubernetes, or both. Prerequisites: you know what a Collector does (receive, process, export) and can deploy a container or a process to your environment. Here we compare the topologies, not the receiver config.
The patterns at a glance
There are five deployment shapes worth knowing — plus the no-collector baseline of exporting straight from the SDK. Most real deployments use two of them together.
| Pattern | Where it runs | Best for | Trade-offs |
|---|---|---|---|
| Agent per host | One process on every VM/host | VM fleets; local hostmetrics, filelog, journald |
One config × N hosts to manage; shares host resources |
| DaemonSet | One pod per Kubernetes node | Node + pod telemetry in K8s; the standard K8s agent | Node-level blast radius; competes for node resources |
| Sidecar | One container per application pod | Strict pod isolation; per-app config; short-lived jobs | Multiplies collector count; overhead per pod |
| Gateway / aggregation | Central standalone deployment | Tail sampling, egress control, backend fan-out | New tier to run and keep HA; sits in the data path |
| Hybrid (agent + gateway) | Both tiers together | Enterprise scale; separation of local vs fleet work | Most moving parts; two tiers to operate |
| No collector (SDK direct) | Nothing — SDK exports to backend | Prototypes, serverless, tiny footprints | No local buffering, shaping, or backend flexibility |
The rest of this post is when to reach for each.
Agent per host / DaemonSet
The agent pattern runs a collector as close to the telemetry as possible — one per host. On VMs that’s a process (systemd unit, say) on every machine. In Kubernetes the equivalent is a DaemonSet: the scheduler guarantees exactly one collector pod per node, and it lives and dies with the node.
This is the workhorse for local collection. The agent scrapes hostmetrics, tails
filelog and journald, reads the kubelet’s kubeletstats, and receives OTLP from
applications on localhost. Because it’s on the node, it has the local context —
k8sattributes, host identity — to tag data correctly at the source.
# DaemonSet agent — collect node + pod telemetry, forward to the gateway
receivers:
  hostmetrics: { collection_interval: 30s, scrapers: { cpu: , memory: , disk: , network: } }
  filelog: { include: ["/var/log/pods/*/*/*.log"] }
  otlp: { protocols: { grpc: { endpoint: 0.0.0.0:4317 } } }
processors:
  k8sattributes:
exporters:
  otlp/gateway: { endpoint: "otel-gateway.internal:4317" }
service:
  pipelines:
    metrics: { receivers: [hostmetrics, otlp], processors: [k8sattributes], exporters: [otlp/gateway] }
    logs: { receivers: [filelog], processors: [k8sattributes], exporters: [otlp/gateway] }
The trade-off is resource sharing: the DaemonSet competes with your workloads for node
CPU and memory, so keep it light (set memory_limiter, push heavy work downstream) and
its blast radius is one node — if it dies, you lose collection on that node until it
restarts, not fleet-wide.
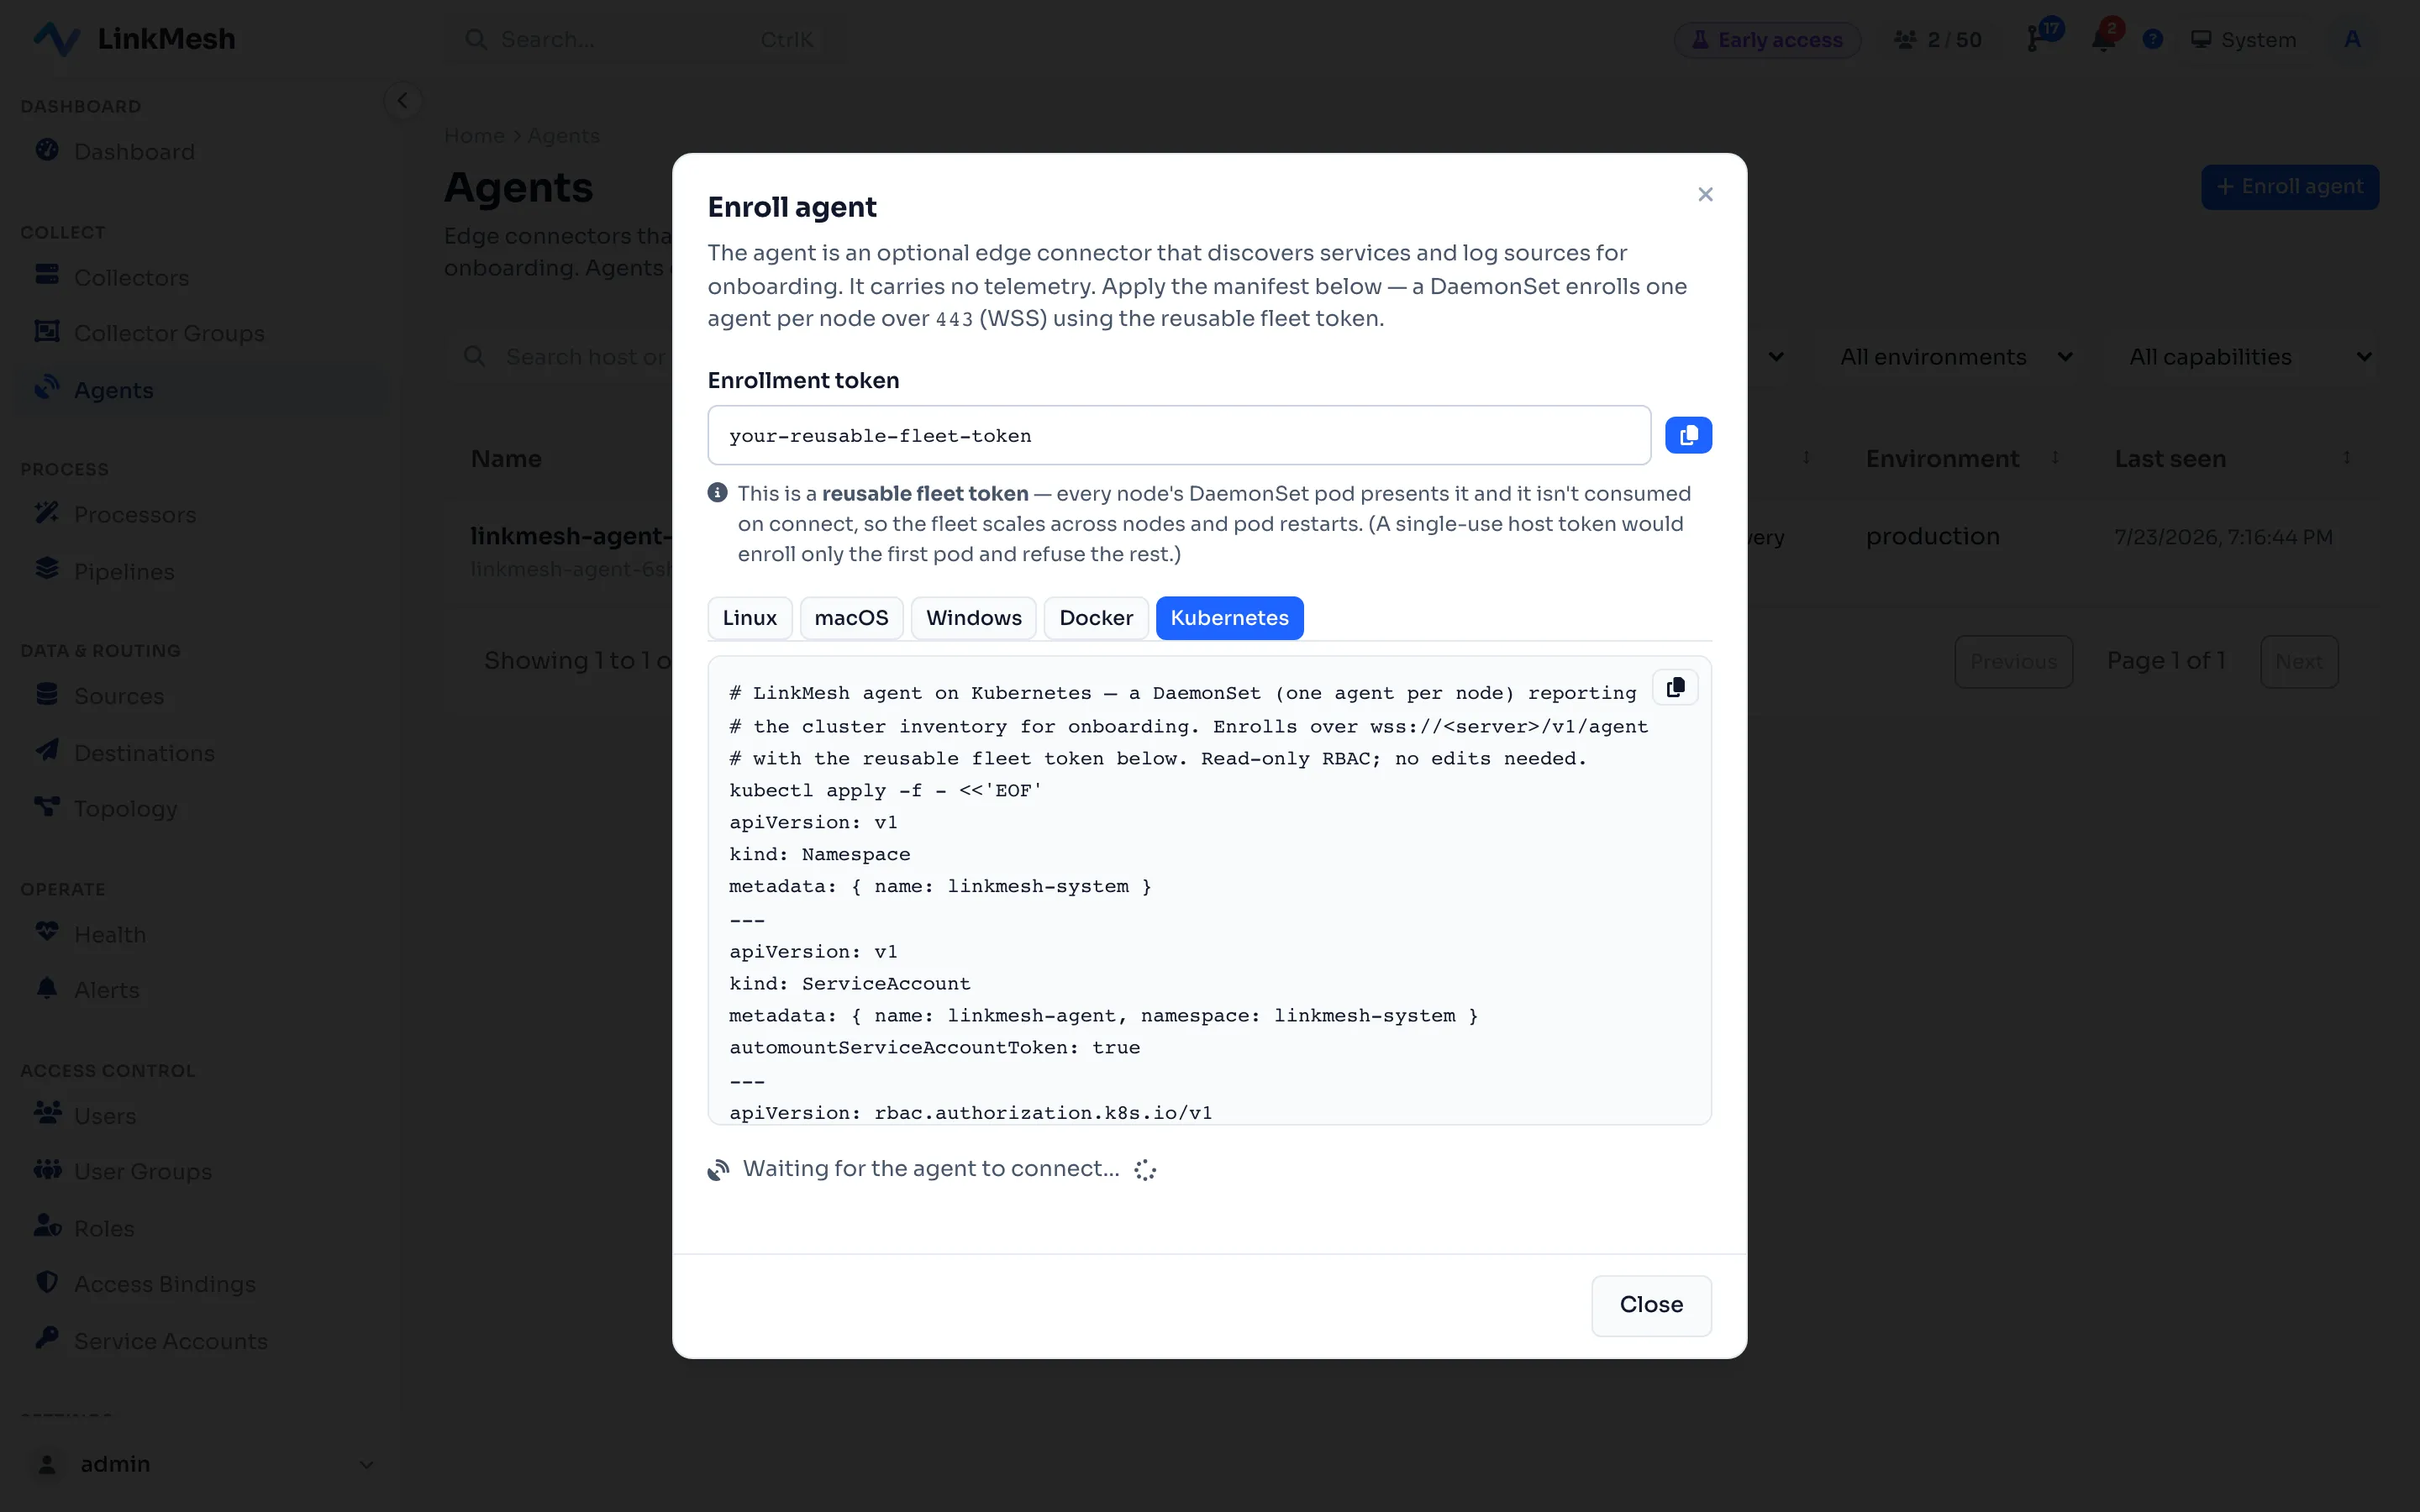
A control plane can make this a one-liner. In LinkMesh, the Enroll Agent wizard hands you a ready-to-apply DaemonSet manifest — one agent per node, reusable fleet token pre-filled, read-only RBAC and pod-log mounts already wired:
Sidecar
The sidecar pattern runs a collector inside each application pod, as an extra
container next to the app. The app exports to localhost and the sidecar handles the
rest. It’s the tightest coupling available.
Reach for it when you need per-application isolation or config — one team’s noisy collector can’t affect another’s — or when the workload is short-lived and you want its telemetry flushed before the pod terminates, which a shared node agent might miss. Batch jobs and per-tenant workloads are the classic fits.
The cost is multiplication. A sidecar per pod means your collector count tracks your pod count, each with its own memory overhead, and every one is a config to manage. For most teams a DaemonSet agent covers what a sidecar would, at a fraction of the footprint — so use sidecars where the isolation is a genuine requirement, not by default.
Gateway / aggregation tier
The gateway pattern runs collectors as a central, standalone deployment that agents (or apps) ship to — a horizontally scaled service, load-balanced, deployed once for the cluster or region rather than once per host.
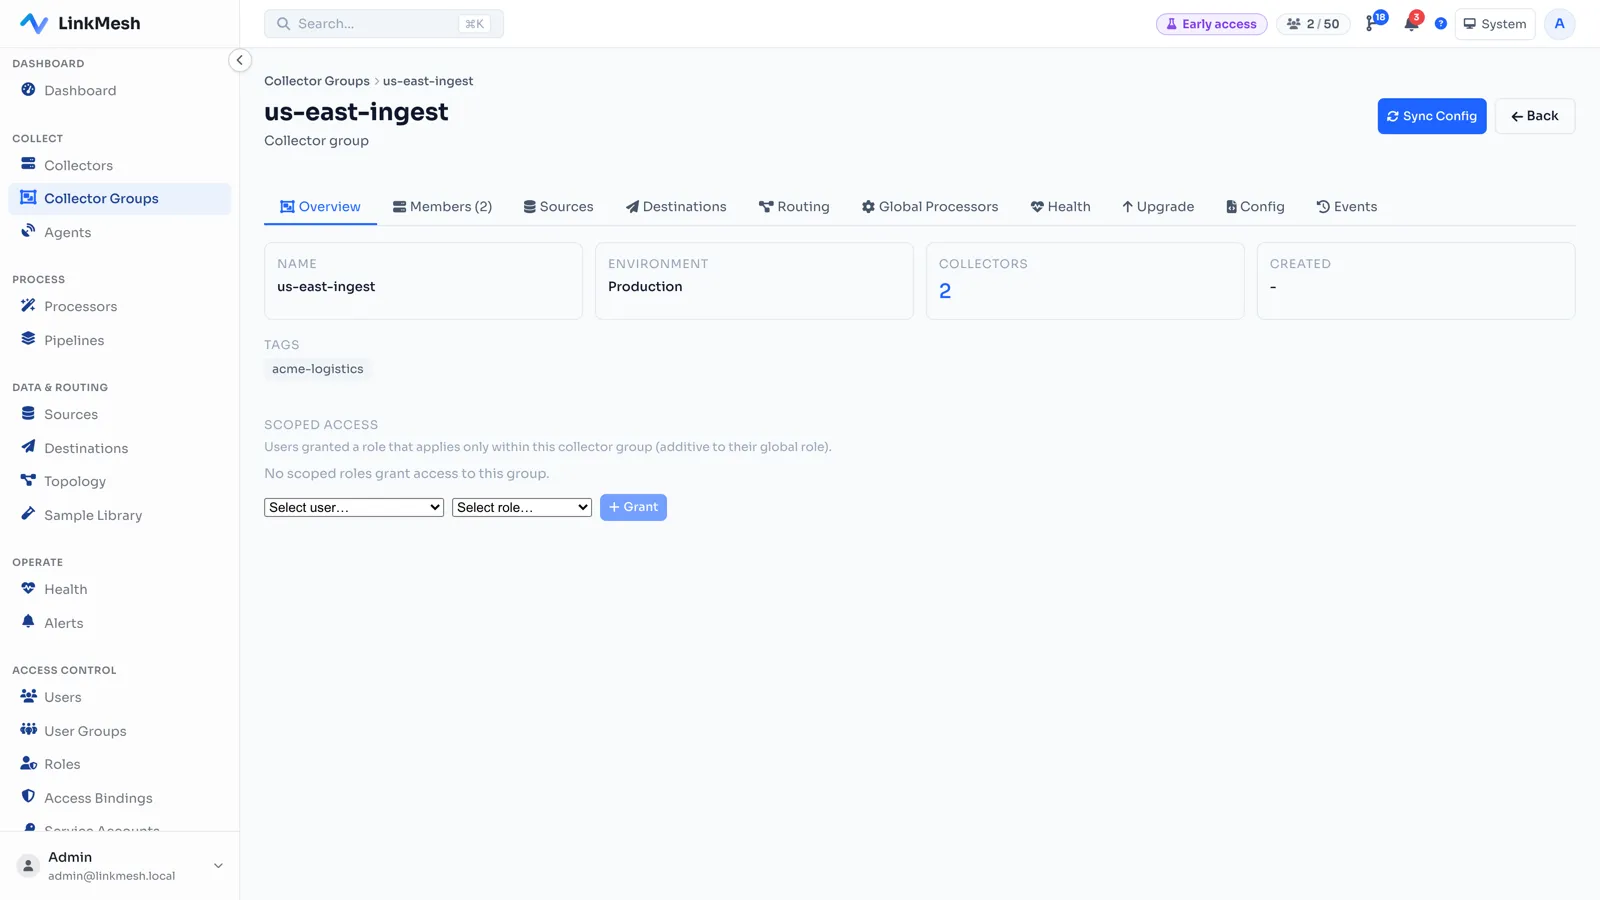
In LinkMesh a gateway tier is a collector group: add the nodes as members and they all run the same group-scoped sources, pipelines and destinations — you configure the tier once, not once per node, and new members inherit it on join.
The gateway is where the fleet-wide, expensive, and stateful work belongs:
- Tail-based sampling, which needs whole traces assembled in one place.
- Egress control — a small, firewalled set of nodes talk to external backends instead of every host opening its own connection.
- Backend fan-out — route the same stream to multiple destinations, changed once here instead of on every agent.
# Gateway — receive from agents, sample, and fan out to backends
receivers:
  otlp: { protocols: { grpc: { endpoint: 0.0.0.0:4317 } } }
processors:
  tail_sampling: { policies: [{ name: errors, type: status_code, status_code: { status_codes: [ERROR] } }] }
exporters:
  otlphttp/primary: { endpoint: "https://backend-a.internal:4318" }
  otlphttp/archive: { endpoint: "https://backend-b.internal:4318" }
service:
  pipelines:
    traces: { receivers: [otlp], processors: [tail_sampling], exporters: [otlphttp/primary, otlphttp/archive] }
The honest trade-off: the gateway is a new tier you have to run, scale, and keep available, and it sits directly in the telemetry path — if it’s down, data backs up or drops. That’s why gateway high availability and safe config rollout are their own disciplines.
Hybrid: agent + gateway
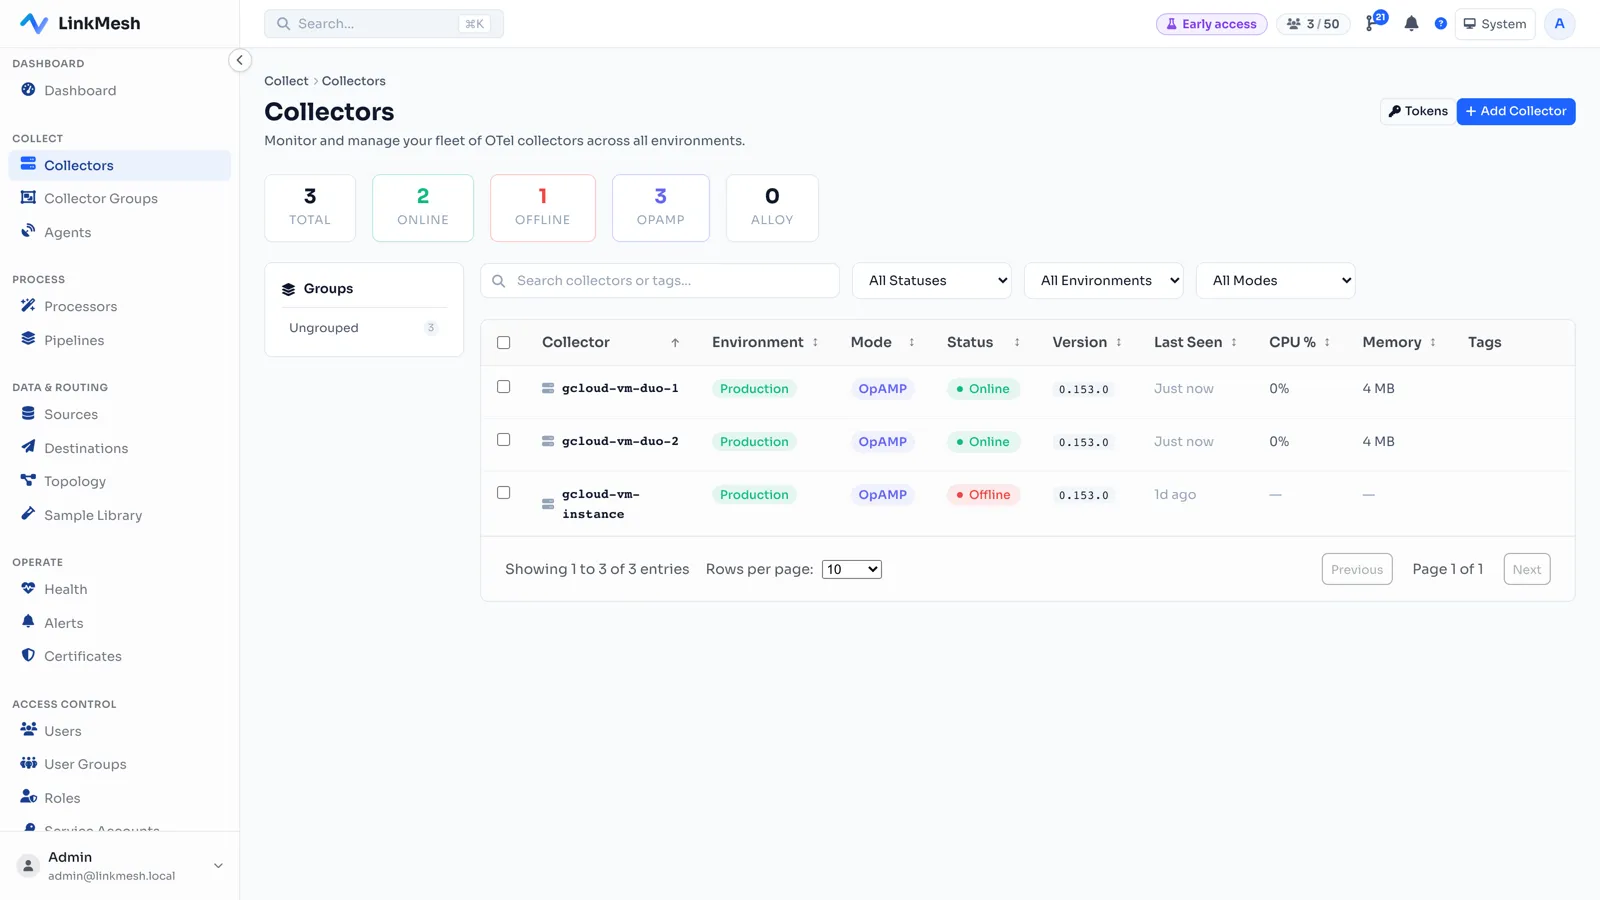
The pattern most enterprises actually run is both: agents on every host for local collection, forwarding to a central gateway tier for aggregation and egress. Light work at the edge, heavy work in the middle, telemetry converging where it needs to.
No collector — and why you usually still want one
You can skip the collector entirely: OpenTelemetry SDKs can export OTLP straight to a backend. For a prototype, a demo, or a serverless function where running a sidecar is awkward, that’s a legitimate choice — fewer moving parts, nothing extra to deploy.
But in production you almost always still want a collector between the app and the backend, for reasons the SDK can’t cover:
- Buffering and retries. A collector queues and retries when the backend is briefly unavailable. Direct-from-SDK, a backend blip drops data or blocks the app.
- Shaping and redaction. Filtering noise, sampling, and masking PII belong in the pipeline, not baked into every service’s code.
- Backend flexibility. Change or add a backend by editing collector config, not by redeploying every application.
- Offloading the app. Export batching and egress are the collector’s job, not something to run on your service’s critical path.
The SDK-direct pattern trades all of that away for simplicity. Fine early; a liability at scale. This is the same theme as what a telemetry pipeline is for — the collector is the seam that keeps instrumentation and backends independent.
Kubernetes specifics
Kubernetes makes two of these patterns first-class:
- DaemonSet is the native way to get one agent per node — the scheduler handles placement and lifecycle for you.
- The OpenTelemetry Operator manages Collector deployments as a CRD and can auto-inject sidecars into annotated pods, plus handle SDK auto-instrumentation. It turns “deploy a collector” into a declarative resource rather than hand-rolled manifests.
A common, clean layout: an Operator-managed DaemonSet for node and pod telemetry,
forwarding to a Deployment-mode gateway for sampling and egress — the hybrid
pattern, expressed in two Kubernetes resources. If you’re weighing the collector against
Grafana’s agent, the Alloy vs OpenTelemetry Collector
comparison covers that choice; both fit these same topologies.
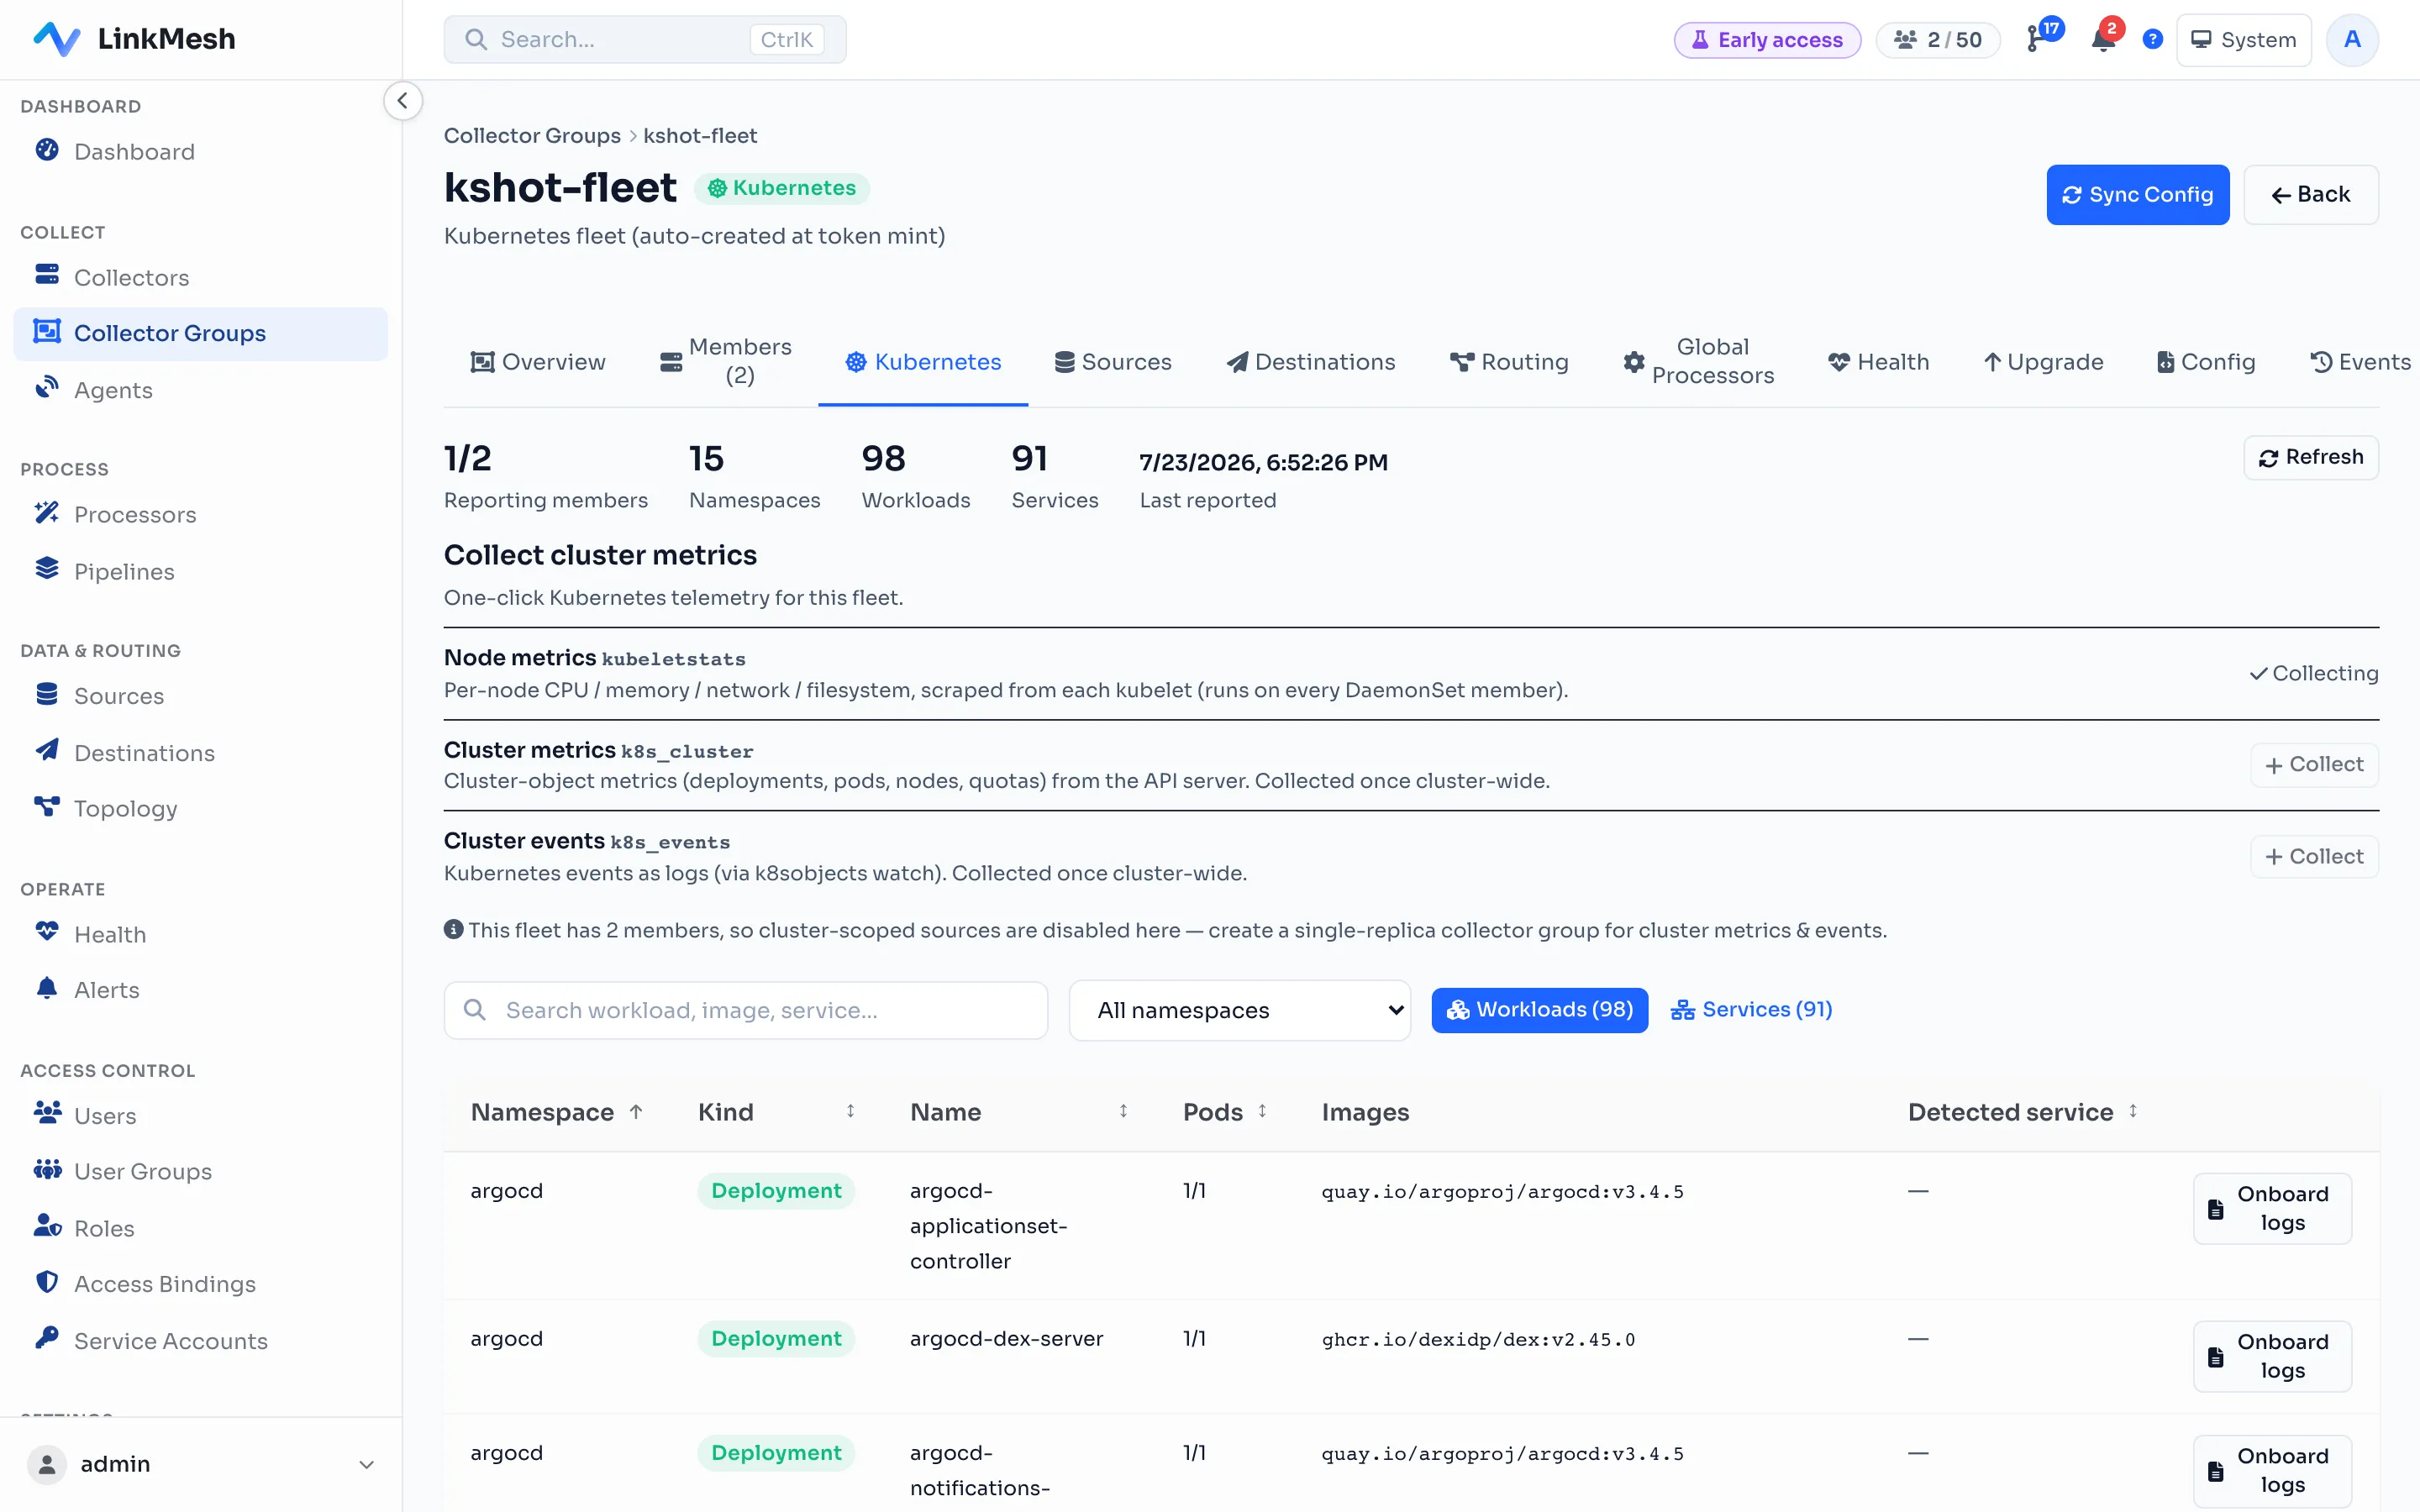
Once a DaemonSet fleet is running, a control plane can read the cluster it lives in. In
LinkMesh, the fleet’s Kubernetes tab lists every namespace, workload, and service the
agents discovered — and onboarding a workload’s logs, or turning on node and cluster
metrics, is one click rather than hand-written filelog globs and kubeletstats config:
Choosing, in one paragraph
Start with an agent (DaemonSet or per-host) — it’s the default and covers most local collection. Add a gateway when you need tail sampling, centralized egress, or backend fan-out; that combination is the hybrid pattern, and it’s where most enterprises end up. Use a sidecar only where per-pod isolation is a real requirement. Reach for no collector only in prototypes or serverless corners where the overhead genuinely isn’t worth it. The binary is the same each time — you’re choosing placement, blast radius, and where the expensive work runs.
Whatever mix you pick, the operational question is identical: many collectors, one consistent configuration, no drift. That’s a fleet-management problem, which is where a control plane on OpAMP earns its keep — one place to configure every agent, sidecar, and gateway, and to prove what’s actually running on each.
If the cluster runs regulated workloads, the deployment pattern is the easy half — what the collector does with namespaces, pod logs and the audit log is in Kubernetes & OpenShift observability in regulated IT.
Every pattern here multiplies into a fleet, and a fleet needs one source of truth for config. LinkMesh is a self-hosted OpAMP control plane that composes, validates, and pushes collector config to your agents, sidecars, and gateways alike — with per-edge throughput and version-by-version audit so you can see exactly what each node is running. Priced per collector, not per GB. Stand one up in minutes, or see what it does.