

 LinkMeshObservability Data Collection Management
Entra ID audit logs through OpenTelemetry
No Sentinel required. Stock otelcol-contrib.
 Mia AI marketing agent← Back to blog
TL;DR
- Entra ID audit logs, Azure resource logs and Azure metrics can reach a stock
otelcol-contrib0.153 with no custom build. Logs go through an Event Hub, metrics are pulled from the Azure Monitor API. - We ran it end to end on Entra ID Free. Audit logs work there. Sign-in logs need Entra ID P1 or P2, and we did not test them.
- Four things bite: no checkpoint by default (events are lost on restart), the default SAS policy is far too powerful for a collector, diagnostic logs arrive minutes late, and one config key in the metrics receiver breaks 0.153.
- Every Azure audit record carries the caller’s UPN and IP address. Mask them before the records reach a SIEM.
Plenty of teams want their Microsoft Entra ID audit trail in the same place as everything else, and the default answer is a Microsoft-shaped one. This post is the other answer: send it through the OpenTelemetry Collector you probably already run. We built it in a throwaway Azure subscription, wrote down every trap, and tore it down the same day.
What works on Entra ID Free, and what we did not test
The lab tenant was a Microsoft 365 Business Standard tenant with Entra ID Free. On that tier we got:
- Entra ID audit logs (the
AuditLogscategory): yes. We changed an app registration and a service principal and both records arrived. - Azure resource logs, using an empty Key Vault as the example resource: yes.
- Azure Monitor metrics for the Event Hubs namespace and the Key Vault: yes.
Two things we could not prove, and will not claim:
- Entra sign-in logs (all the
SignIncategories) need Entra ID P1 or P2. Our tenant has neither. - Intune logs need an Intune licence. The diagnostic setting saves without one, but nothing flows. We had no Intune, so this half is untested.
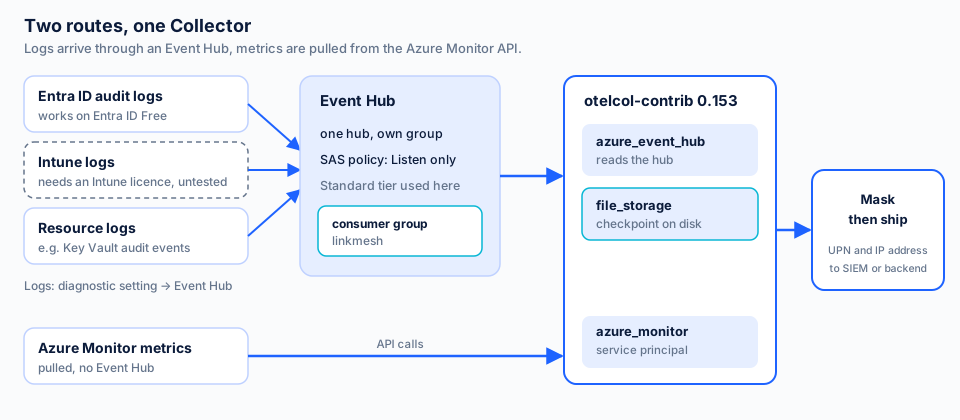
Figure 1. Logs travel through an Event Hub, metrics are pulled from the Azure Monitor API. Intune is dashed because we did not test it.
Set up the Azure side
You need a resource group, an Event Hubs namespace, one event hub, a consumer group and an access policy. Whoever creates the Entra diagnostic setting needs the Security Administrator or Global Administrator role.
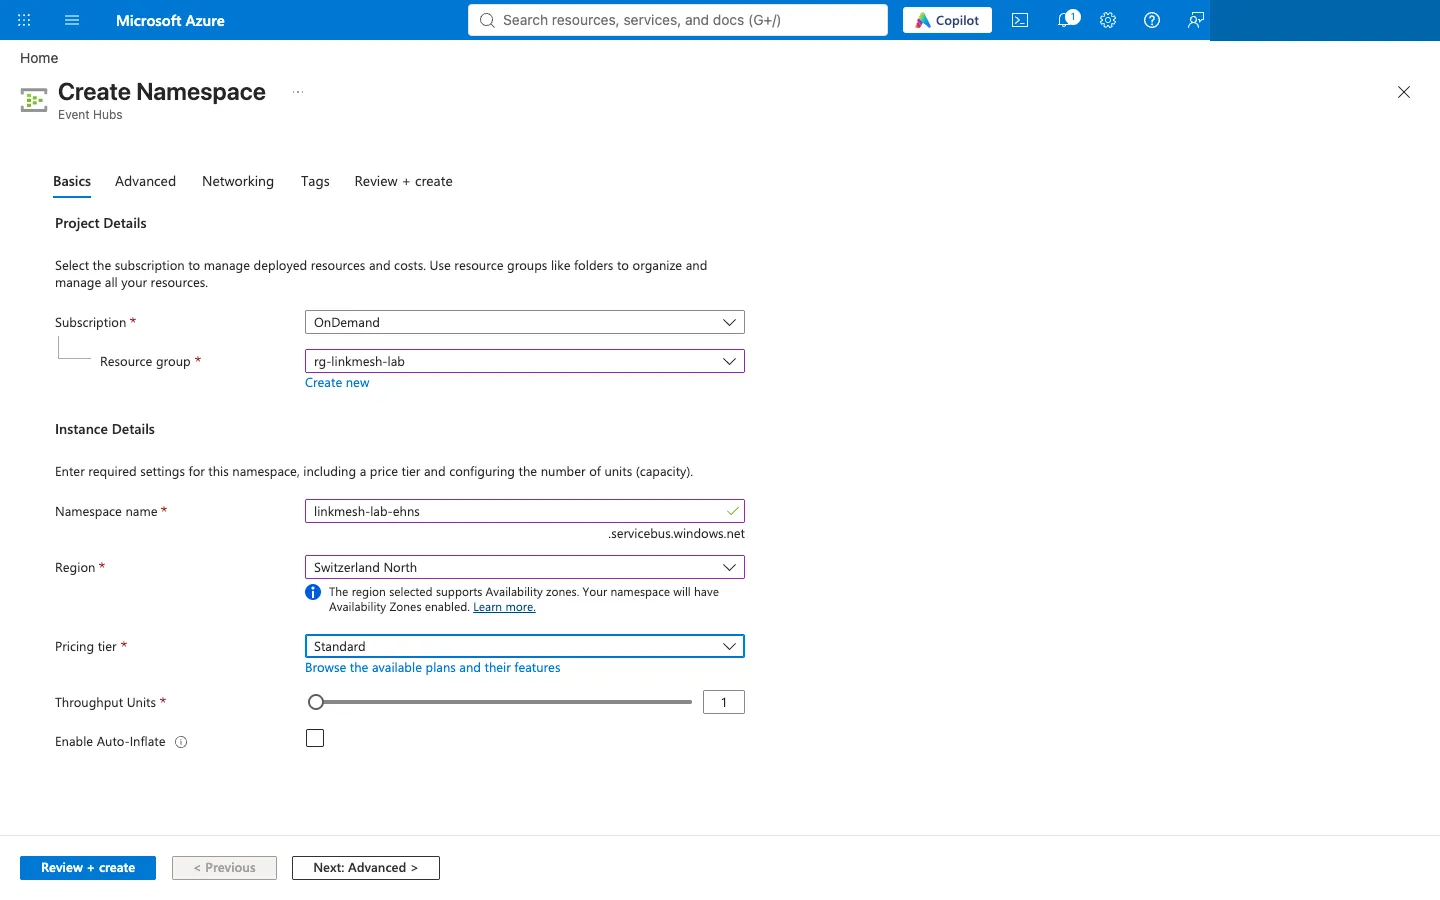
Figure 2. The namespace we used: Standard tier, one throughput unit.
A few choices that mattered:
- One hub, one partition, a dedicated consumer group. Create your own group (we called it
linkmesh) and never read from$Default. Other readers will use$Defaultsooner or later. - A Listen-only policy for the collector. Create a shared access policy on the hub with only the Listen claim and build the connection string from that.
- Tier. We used Standard. The
azure_event_hubreceiver speaks AMQP with a connection string, so Basic is likely enough, but we did not try it. Standard is only required for Kafka clients, which this setup does not use.
Then add a diagnostic setting on the Entra tenant (Entra ID, Monitoring, Diagnostic settings), tick AuditLogs, choose “Stream to an event hub” and point it at your hub.
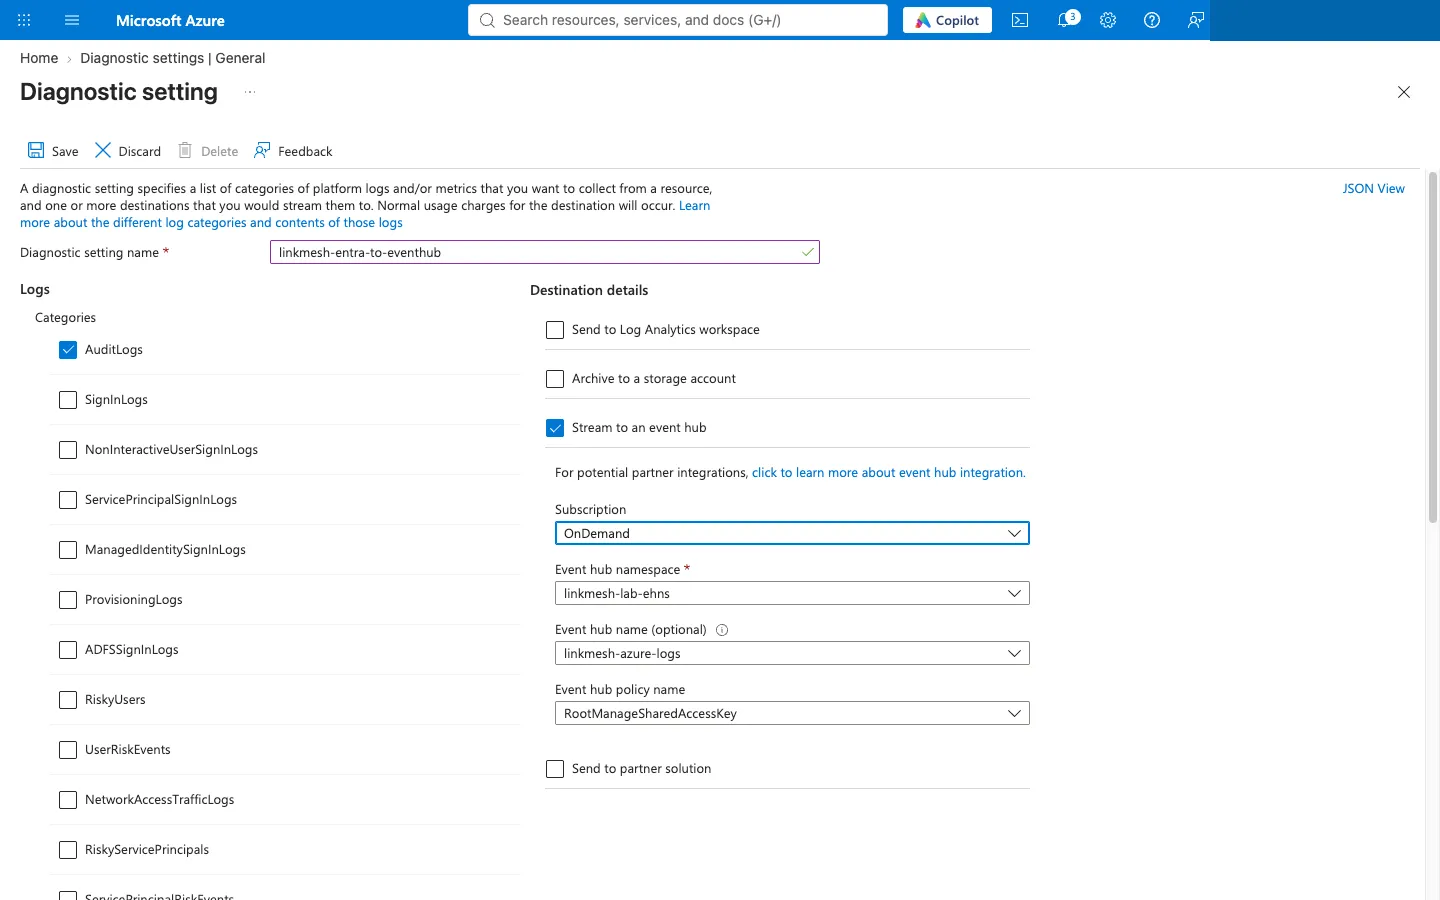
Figure 3. The diagnostic setting. Note the pre-selected policy name, which comes up again below.
For an Azure resource such as a Key Vault, create the same kind of diagnostic setting on the resource itself, with the audit category group.
The Collector side
This is plain otelcol-contrib. Nothing here needs a custom distribution.
extensions:
  file_storage/eventhub:
    directory: /var/lib/otelcol/storage

receivers:
  azure_event_hub:
    connection: ${env:AZURE_EVENTHUB_CONNECTION}   # Listen-only SAS, includes EntityPath
    group: otel                                    # your own consumer group
    format: azure                                  # structured azure.* attributes
    storage: file_storage/eventhub                 # checkpoint, see trap 1

  azure_monitor:
    subscription_ids: ["<subscription-id>"]
    resource_groups: ["<resource-group>"]
    tenant_id: <tenant-id>
    client_id: <app-id>
    client_secret: ${env:AZURE_CLIENT_SECRET}
    collection_interval: 60s

service:
  extensions: [file_storage/eventhub]
  pipelines:
    logs:
      receivers: [azure_event_hub]
      exporters: [otlphttp]
    metrics:
      receivers: [azure_monitor]
      exporters: [otlphttp]
Two notes on what we actually ran. Our lab used the older receiver names azureeventhub and azuremonitor, which 0.153 still accepts with a deprecation warning that points to the underscore names used above. And our run had no storage extension, which is exactly how we found the first trap.
The metrics side uses a service principal that holds Monitoring Reader on the resource group only. That is all azure_monitor needs to read metrics, so do not give it more.
The traps
This is the part we would have liked to read first.
1. No checkpoint means lost events on restart
Without a storage extension the azure_event_hub receiver starts at the latest offset every time it starts. Anything published while the collector is down or restarting is skipped.
We measured it. Six messages reached the hub before the receiver started and were never read: in that five-minute bucket the Event Hub showed 6 incoming and 0 outgoing. Add storage: with a file_storage extension as in the config above. The receiver’s own documentation recommends it for production. We did not re-run the lab with it, so the “with checkpoint” lane in the figure is documented behaviour, not our measurement.
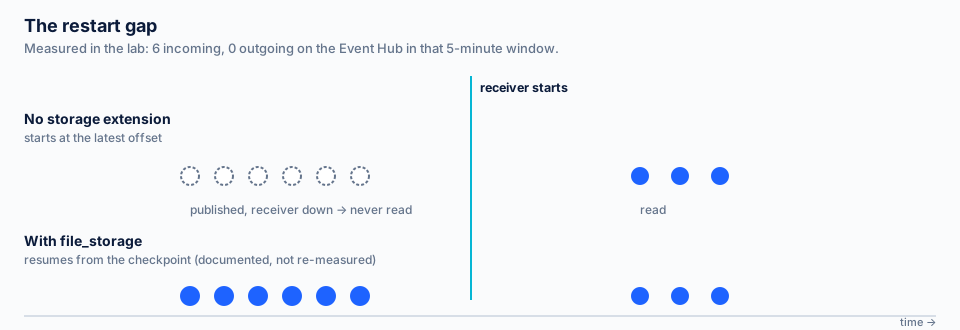
Figure 4. The restart gap, from the lab. The lower lane is documented behaviour, not a measurement of ours.
2. Never give the collector RootManageSharedAccessKey
The portal pre-selects RootManageSharedAccessKey as the policy name when you create a diagnostic setting (see Figure 3). That policy can manage the namespace. It is fine for Azure’s own write side, but it must never end up in a collector config. Give the collector a policy with the Listen claim on the single hub, and keep the connection string out of the YAML: we used a secret reference, and ${env:...} works in stock configs.
3. Diagnostic logs are late
Azure does not stream these logs in real time. Key Vault audit events arrived after about two minutes. Entra audit logs took between five and fifteen minutes, and our two test records showed up after about nine. Do not judge the pipeline by watching it for thirty seconds. Wait.
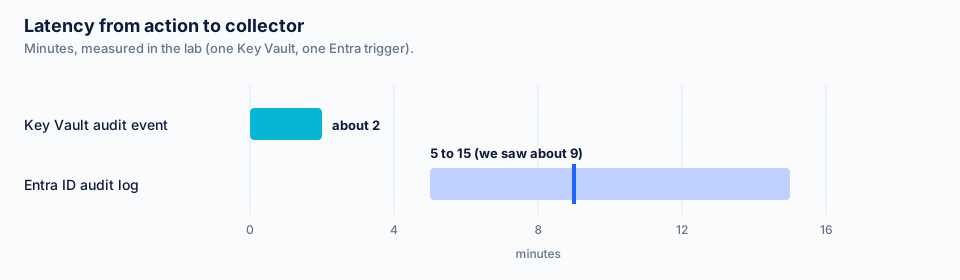
Figure 5. Latency from action to collector, one Key Vault and one Entra trigger in a one-user lab tenant.
4. The auth: service_principal key breaks 0.153
An older azure_monitor config tells the receiver auth: service_principal. In 0.153, auth is a struct, and the collector refuses the whole config with 'auth' expected a map or struct, got "string". Leave the key out. Service principal is the default. The warnings for the renamed receivers and for credentials (now auth.authenticator) are the same kind of drift: harmless today, a breaking change later.
5. Two portal traps
- The Entra diagnostic setting picks the subscription alphabetically, not the one that holds your hub. The event hub list then says “No event hubs found” until you switch the subscription dropdown.
- A resource cannot stream to its own Event Hubs namespace. The namespace does not show up as a target in its own diagnostic setting, so use a second namespace or another resource.
What a record looks like
With format: azure the log body is empty. Everything lands in attributes: azure.category, azure.operation.name, azure.result.type, nested azure.identity and azure.properties, plus network.peer.address and cloud.provider. The resource attribute azure.resource.id arrives uppercased for resource logs. An Entra audit record carries the operation name, the target resources and who initiated the change, and was about 3.7 KB in our OTLP-JSON capture.
We have not measured daily volume. A one-user tenant produces almost nothing that is not our own doing, so any 24-hour count from it would tell you nothing about yours.
Mask before the SIEM
Look at that record again. Every Azure audit event carries the caller. For a Key Vault event, azure.identity holds the full token claims of the caller, including upn, unique_name, ipaddr and oid. The Entra record puts the initiating user’s UPN in azure.properties, and the source IP in network.peer.address. That is personal data in every single record.
If those records are going to a SIEM, mask or drop the UPN and IP before they leave the collector. The stock transform and redaction processors can do it. Because the values sit in nested maps, test the rule against a real record, not against what you expect the shape to be.
This is where we use it. LinkMesh manages Collector fleets and their config, and today you add the Azure receivers to it as custom source blocks, which is how we ran this lab. Guided templates for them are planned, so you will not need to hand-write the YAML.
What it cost, and what we did not test
The lab ran about an hour. Event Hubs Standard with one throughput unit lists at roughly USD 0.03 per hour, so left running it would be around USD 22 a month. Key Vault, the service principal and the diagnostic settings cost nothing at our volume. We put a budget alert on the resource group and deleted the group when we were done.
Not tested, so not claimed: Entra sign-in logs (P1 or P2), Intune logs (Intune licence), Event Hub Basic tier, real daily volumes, and the checkpoint behaviour with file_storage enabled.
Entra is one of three clouds with the same question: do you pull from the API, push through a bus, or export to storage? Event Hubs is the push path on Azure. For how the same job looks on AWS and Google Cloud, and how to choose between the three, read Telemetry from AWS, Azure and Google Cloud: Pull vs Push.
If you run Collectors on Azure already, the receiver config above is a few lines. The hard part was never the YAML: it is the checkpoint, the credential scope and the personal data in every record. Install LinkMesh to manage that config across your fleet, or read how we handle secrets in Collector config.