

 LinkMeshObservability Data Collection Management
Splunk Enterprise → OpenTelemetry
Retire the forwarders. Keep the data. Drop the per-GB bill.
 Roman Hüsler← Back to blog
Splunk is a genuinely powerful platform, and for a lot of teams it earned its place. But two things push teams to look for the exit: the ingest-priced bill that climbs with every gigabyte you index, and the forwarder estate — a fleet of universal forwarders and HEC endpoints that only speak Splunk and only feed Splunk.
The good news is that leaving Splunk no longer means a rip-and-replace. With OpenTelemetry you can put a vendor-neutral collection layer under your existing pipeline, keep Splunk running as one destination among several, and cut the volume you pay to index — all before you commit to a full cutover. This guide walks the migration end to end, including how to validate parity and roll back.
Platform, SRE, and observability teams running Splunk Enterprise for log and event ingestion who want to cut index-time cost and stop being locked to Splunk-only forwarders. Prerequisites: you can deploy an agent (systemd, container, or DaemonSet) to your hosts, and you have somewhere to send OTLP — Splunk itself (via HEC) to start, plus a candidate backend to compare against.
First: which “Splunk” are we migrating?
“Splunk to OpenTelemetry” is ambiguous, and getting specific up front saves you a scoping mistake. This guide is about Splunk Enterprise ingestion — the pipeline that gets data into Splunk indexers. Know which components you actually run:
- Universal Forwarder (UF) — the lightweight agent that tails files and Windows event logs and forwards them. This is the biggest thing OTel replaces.
- Heavy Forwarder (HF) — a full Splunk instance used for routing, filtering, and parsing before indexing. Its filter/route logic maps to Collector processors.
- HTTP Event Collector (HEC) — the token-based HTTP ingest endpoint. Both a
source you may replace (apps push OTLP instead) and a destination you keep (the
Collector’s
splunk_hecexporter writes to it). - Splunk Connect for Kubernetes — the old Helm-based K8s log/metric collector, end-of-support since January 2024. Splunk’s own replacement is the OTel-based Splunk OpenTelemetry Collector for Kubernetes — on K8s, even Splunk’s answer is already OpenTelemetry.
- Splunk Distribution of the OpenTelemetry Collector — Splunk’s own signed OTel Collector build. If you already run it, you’re partly on OTel already; this guide’s processor and routing work still applies, you just swap the exporter.
One more disambiguation: Splunk Enterprise (self-managed log platform) is a different product from Splunk Observability Cloud (the SignalFx-lineage APM/metrics SaaS). This guide targets Splunk Enterprise ingestion. The pipeline mechanics carry over to Observability Cloud, but the receivers and metric conventions differ.
If you want the bigger-picture argument for why this is possible at all, start with Reducing vendor lock-in with OpenTelemetry and what OpenTelemetry can and cannot replace. This post is the Splunk-specific playbook.
What migrates to OpenTelemetry — and what doesn’t
OTel replaces the ingest and forwarding layer. It does not replace Splunk’s index, its search, or SPL — those stay in Splunk if you keep it, or get rebuilt if you leave:
| Splunk capability | Move to OTel? | Notes |
|---|---|---|
File / WinEventLog collection |
Yes | filelog / windowseventlog receivers replace the Universal Forwarder. |
| HEC ingest from apps | Yes | Apps emit OTLP to the Collector; or keep HEC and add the splunk_hec receiver. |
| Syslog ingest | Yes | syslog receiver (RFC 3164 / 5424). |
HF parsing / routing (props/transforms) |
Yes | transform / filter processors (OTTL) and the routing connector. |
| Index-time field extraction | Often | Recreate as processors; some SPL-time extractions stay search-side. |
| Indexing & storage | No | Splunk indexers, or a replacement backend. Not an OTel concern. |
| SPL searches & saved searches | No | Query language is backend-specific; rebuild if you leave Splunk. |
| Dashboards & reports | No | Rebuild in the new backend, or keep Splunk for them. |
| Alerts / scheduled searches | No | Migrate separately to the new backend’s alerting. |
Map the Splunk pieces to their OTel equivalents
Most of the migration is a one-to-one substitution. Every Splunk collection component has an OpenTelemetry counterpart:
| Splunk | OpenTelemetry equivalent |
|---|---|
Universal Forwarder (files, WinEventLog) |
OTel Collector with the filelog / windowseventlog receivers (plus journald for systemd journals) |
| HTTP Event Collector (HEC) | OTLP receiver (gRPC + HTTP) |
| Syslog input (TCP/UDP) | syslog receiver (RFC 3164 / 5424) |
props.conf / transforms.conf (SEDCMD, field extraction) |
transform / filter / attributes processors (OTTL) |
| Heavy forwarder routing | Collector routing connector + multiple exporters |
| Splunk indexer (destination) | splunk_hec exporter — or any OTLP backend |
Note the last row. The splunk_hec exporter means the OTel Collector can write
straight into your existing Splunk indexers over HEC. You do not have to move off
Splunk to adopt OpenTelemetry — you put OTel in front of it first, and decide
about the backend later. That decoupling is the whole trick.
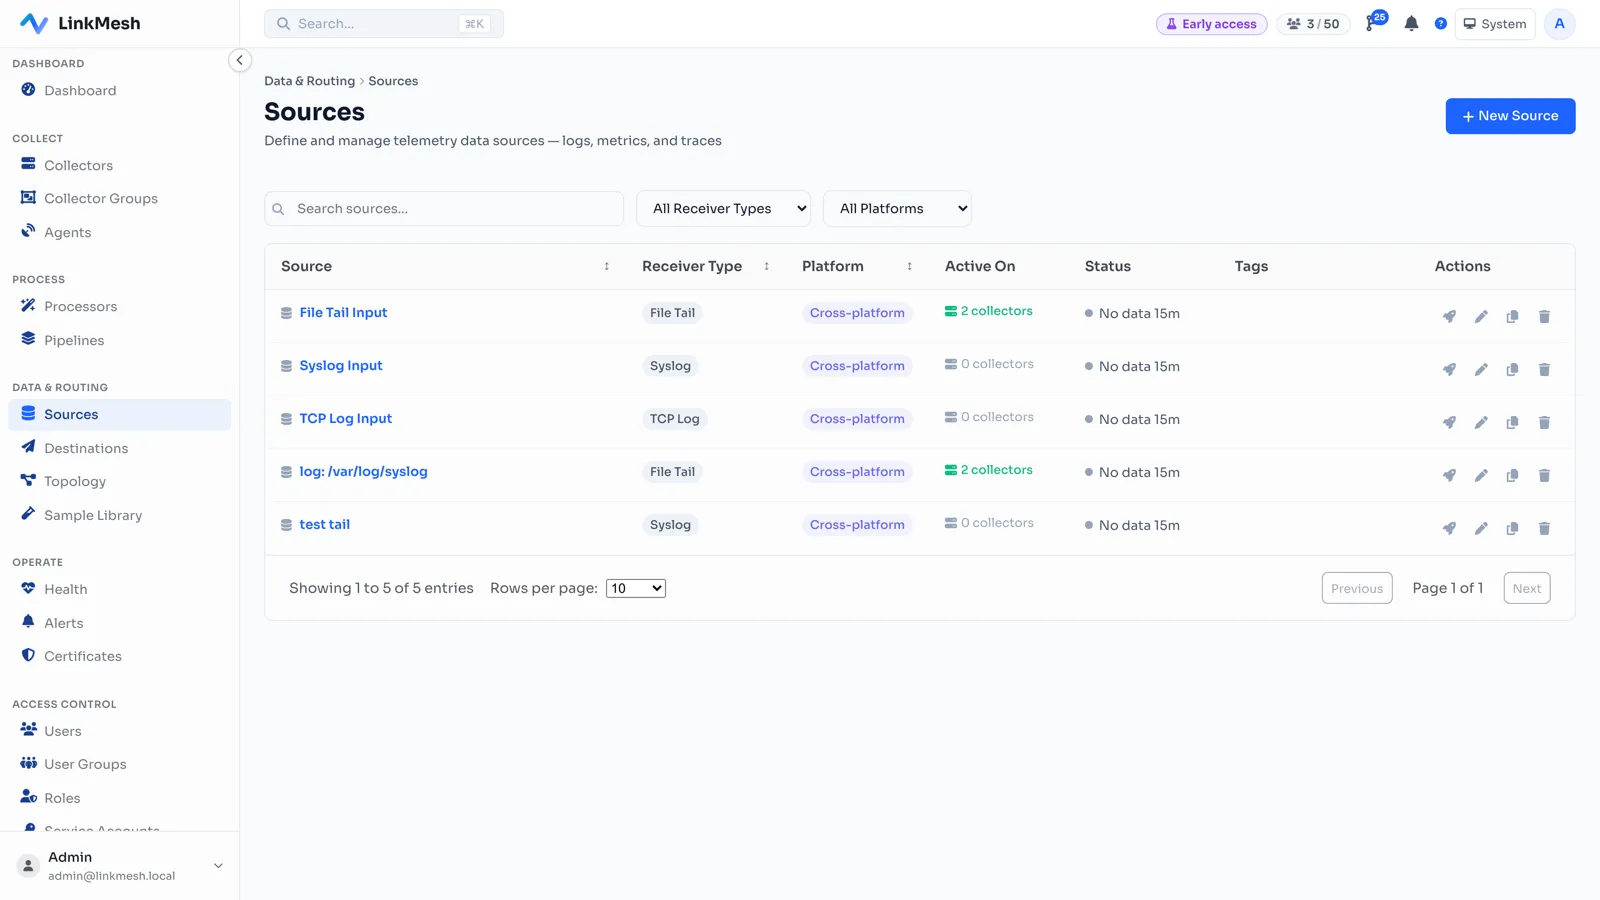
Here’s what that looks like managed centrally — collector sources configured once instead of one forwarder config per host:
Step 1 — Stand up collectors next to the forwarders
Don’t touch the forwarders yet. Deploy OTel Collectors alongside them, reading the same log sources. A minimal filelog-to-Splunk collector looks like this:
receivers:
  filelog:
    include: [/var/log/*.log]
    start_at: end

exporters:
  splunk_hec:
    token: "${SPLUNK_HEC_TOKEN}"
    endpoint: "https://splunk.internal:8088/services/collector"
    source: "otel-collector"

service:
  pipelines:
    logs:
      receivers: [filelog]
      exporters: [splunk_hec]
At this point nothing has changed for your users — data still lands in Splunk, on the same indexes — but the collection layer is now open. Every improvement from here on is one you couldn’t make from inside a universal forwarder.
Step 2 — Dual-ship and compare
Add a second exporter. Keep writing to Splunk, and start writing the same stream to a candidate OTLP backend (Grafana Loki, an OTLP-native store, or object storage). Now you can compare them side by side on real production data — searches, dashboards, alert coverage — with zero risk, because Splunk is still the system of record.
exporters:
  splunk_hec:
    token: "${SPLUNK_HEC_TOKEN}"
    endpoint: "https://splunk.internal:8088/services/collector"
  otlphttp/candidate:
    endpoint: "https://backend.internal:4318"

service:
  pipelines:
    logs:
      receivers: [filelog]
      exporters: [splunk_hec, otlphttp/candidate]
This is the move a proprietary forwarder simply can’t make: send one stream to two backends at once. It’s what makes a Splunk migration a gradual, reversible process instead of a flag day.
Step 3 — Cut the volume you were paying to index
This is where the migration pays for itself. Splunk charges by ingested volume, and
a large fraction of what you index is noise you never search. In a forwarder you
could do a little with props.conf; in an OTel Collector you can do a lot, in a
place you control.
Drop sub-INFO logs before they ever reach an indexer:
processors:
  filter/drop_debug:
    logs:
      log_record:
        - 'severity_number < SEVERITY_NUMBER_INFO'
Sample a high-volume, low-value stream down to a representative fraction:
processors:
  probabilistic_sampler:
    sampling_percentage: 20
Every record dropped at the collector is a record you don’t pay Splunk (or any per-GB backend) to ingest, index, and retain. This is the single biggest lever in the whole migration — see reducing observability costs for the full filter/sample/route playbook.
You can also mask sensitive fields before they leave the host — card numbers, emails, tokens — which shrinks payloads and keeps PII out of the backend at the same time. Doing that client-side, before egress, is covered in PII masking in logs.
Step 4 — Manage the fleet, don’t hand-edit YAML
Here’s the catch nobody mentions: Splunk gives you a Deployment Server to manage the forwarder fleet centrally (every UF ships with the deployment client that phones home to it). Raw OTel Collectors have no equivalent — out of the box you’re hand-syncing YAML across every node, which is a step backwards in manageability from Splunk’s Deployment Server.
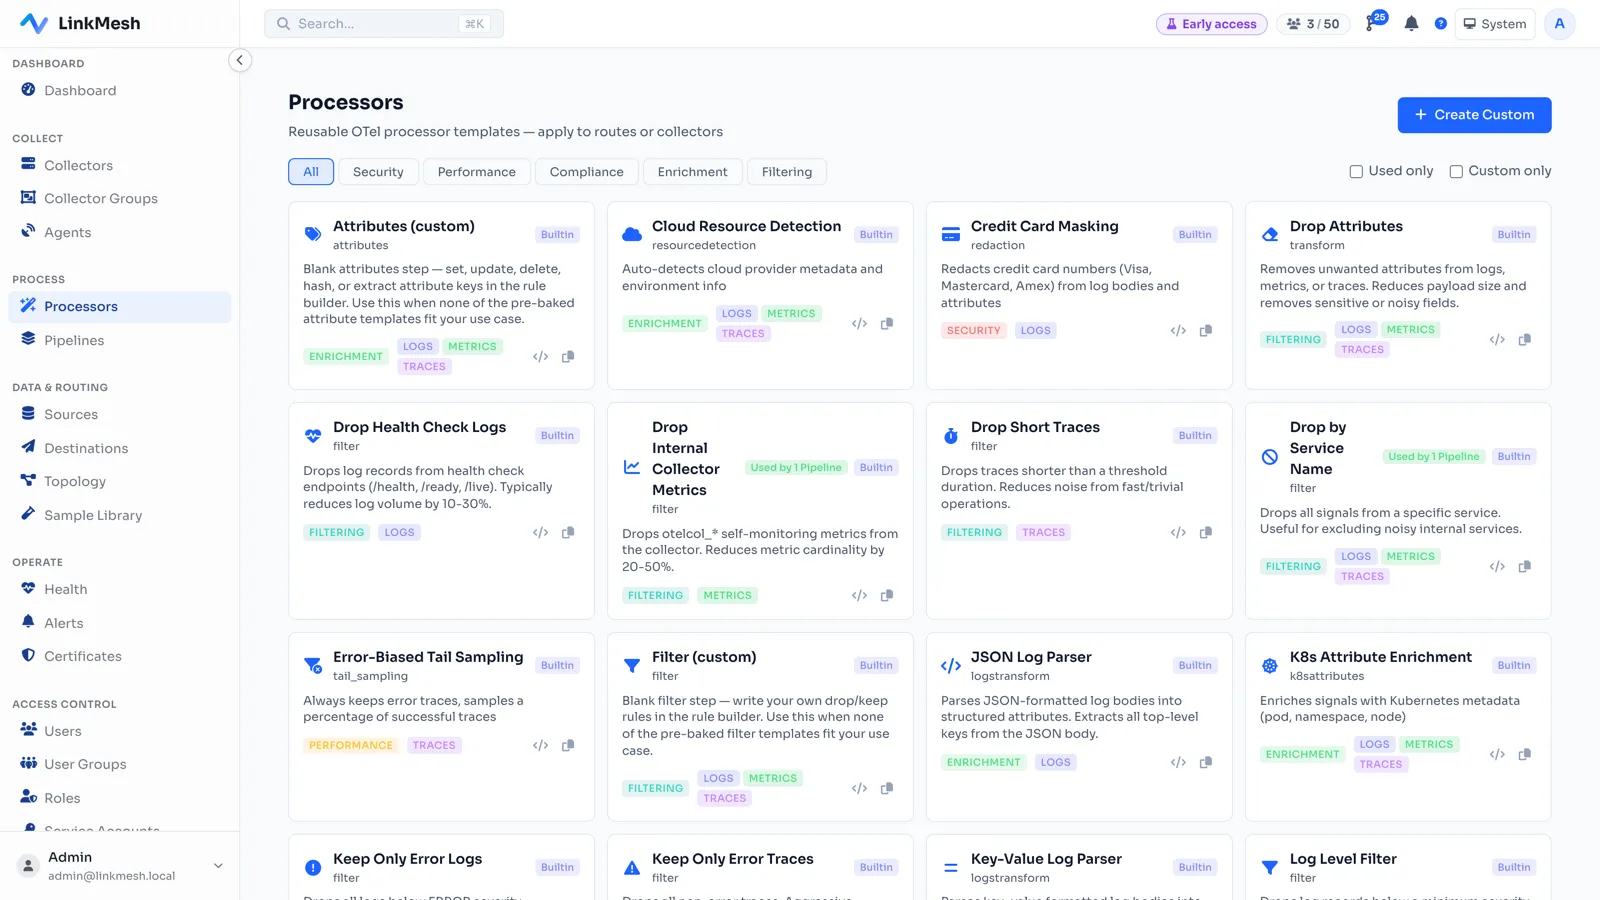
Don’t accept that trade. Manage the collector fleet from a control plane that speaks OpAMP. LinkMesh is a self-hosted one: point each collector at it with a token, then build sources, processors, and routes in a visual UI. It renders and validates the config and pushes it to the right nodes — the deployment-server experience, but for open-standard OTel Collectors, and with per-edge throughput so you can see the volume you just cut. Because it’s priced per collector, not per GB, the tool managing your escape from volume pricing isn’t itself metered by volume. Every config change is versioned and auditable, GitOps-style — see GitOps for collector config.
Validate parity before you cut over
Dual-shipping only de-risks the migration if you actually check the two streams match. Before removing anything, work a validation checklist:
- Volume — compare event counts per source/index between Splunk and the candidate over the same window. A large gap means a dropped source or an over-aggressive filter.
- Completeness — confirm every source type the UF collected has a matching receiver, including Windows event logs and any scripted inputs.
- Parsing — spot-check that timestamps, severities, and key extracted fields land
correctly (OTTL parsing differs from
props.conf; this is the most common gap). - Attribution — verify
service.name, host, and environment resource attributes are present so data is queryable the way your searches expect. - Dropped telemetry — check the Collector’s own internal metrics for refused or dropped records; a silent exporter failure looks like “less noise” until an incident.
- Sampling — confirm sampled streams keep 100% of errors and security events; only the high-volume, low-value majority should thin out.
- Downstream inputs — re-point (or rebuild) the dashboards and alerts that matter most against the candidate and confirm they populate and fire.
- Failure behavior — restart a collector and kill a backend connection; confirm the Collector buffers and resumes without losing data or wedging.
Have a rollback plan
Because you dual-shipped, rollback is built in — but make it explicit before you flip anything:
- Keep the Universal Forwarders running (or easily re-enablable) through the whole validation window. Don’t uninstall on day one.
- Route independently. The Splunk exporter and the candidate exporter are separate blocks; removing one never touches the other, so you can revert a single stream.
- Define success thresholds up front — e.g. “volume within 2%, all priority alerts firing, no parsing regressions for 7 days” — so cutover is a decision, not a vibe.
- Retain the ability to redirect. If the candidate misbehaves, add
splunk_hecback to the pipeline and you’re fully on Splunk again in one config push. - Decommission only after an agreed observation period — typically one to two full business cycles after cutover, not the moment parity first looks right.
Step 5 — Cut over on your own schedule
When the candidate backend has proven itself — dashboards match, alerts fire, the
searches your team relies on work — flip the exporter. Remove splunk_hec from the
pipeline (or keep it for a subset of data you genuinely want in Splunk), and
decommission the universal forwarders stream by stream. Because instrumentation and
collection are now OTLP and OTel, there’s nothing to re-instrument; it’s an exporter
change.
And the migration is genuinely done, not half-done: your telemetry now speaks an open protocol, your agents are managed on open standards, and the next backend decision — if there ever is one — is another exporter block, not another year-long project.
The migration in five moves
- Substitute — deploy OTel Collectors next to the forwarders, exporting to
Splunk via
splunk_hec. Nothing changes for users. - Dual-ship — add a candidate OTLP backend and compare on live data.
- Refine — filter, sample, and mask at the collector to cut ingest volume.
- Validate & keep a rollback — check parity against the checklist above, with the forwarders still in place as your safety net.
- Cut over — flip the exporter when parity holds; retire the forwarders stream by stream after an observation period.
You can run all five with raw OTel Collectors and a lot of YAML, or you can manage the fleet from a self-hosted control plane and skip the hand-syncing. Either way, the collection-layer lock-in is gone the moment your data speaks OTLP.
Splunk manages its forwarder fleet with a Deployment Server; raw OTel Collectors have nothing like it. LinkMesh gives the fleet back a control plane — build, validate, preview, and push collector config over OpAMP, with per-edge throughput so you can prove the volume you cut. Priced per collector, not per GB. Stand one up in minutes, or see what it does.