

 LinkMeshObservability Data Collection Management
Datadog → OpenTelemetry
Replace the Agent. Dual-ship. Cut the per-host and per-GB bill.
 Roman Hüsler← Back to blog
Datadog is the observability platform teams love until the invoice arrives. The product is excellent; the pricing is the problem — per-host infrastructure billing, per-GB log ingest plus per-event indexing, custom-metrics overages, and a stack of per-signal SKUs that make the total genuinely hard to forecast. And the thing tying you to all of it is the Datadog Agent: a single-vendor collector that speaks Datadog and feeds Datadog.
OpenTelemetry is the way out, and the good news is that Datadog itself supports OTLP ingestion — so you can adopt OpenTelemetry without leaving Datadog on day one, then decide about the backend once you’re no longer locked to the agent. This is the Datadog-specific playbook; the broader case is in Reducing vendor lock-in with OpenTelemetry.
Teams running the Datadog Agent for metrics, APM, and logs who want to control the per-host and per-GB bill and stop being locked to a Datadog-only agent. Prerequisites: you can deploy a collector to your hosts/cluster, and you have a Datadog API key (to keep feeding Datadog while you dual-run) plus somewhere to send a second OTLP stream to compare against.
What migrates to OpenTelemetry — and what doesn’t
OTel replaces the Datadog Agent and the wire format. It does not replace Datadog’s backend, its query model, or the analytics features layered on top — those are kept, rebuilt elsewhere, or dropped:
| Datadog capability | Move to OTel? | Notes |
|---|---|---|
| Host / infra metrics | Yes | hostmetrics (+ kubeletstats) replace the Agent’s core checks. |
| APM / distributed tracing | Usually | OTel SDKs, or keep dd-trace and receive it with the Collector’s datadog receiver; validate span/service naming. |
| Logs | Yes | filelog / journald receivers; recreate log-pipeline parsing as processors. |
| DogStatsD custom metrics | Mostly | statsd receiver ingests DogStatsD-format metrics; events and service checks don’t port. |
| Agent integrations (checks) | Often | Many map to the prometheus receiver or OTel receivers; some are Datadog-specific. |
Unified Service Tagging (env/service/version) |
Yes | Map to deployment.environment.name, service.name, service.version resource attributes. |
| Dashboards | No | Rebuild in the new backend, or keep Datadog for them. |
| Monitors / alerts | No | Migrate separately to the new backend’s alerting. |
| Live Processes / Live Containers | Partial | Process/container metrics port; the live-view UX is Datadog-specific. |
| Network Performance Monitoring (NPM) | Usually not | eBPF-based, Datadog-specific; not an OTel-native capability. |
| Watchdog / analytics | No | Vendor analytics; the backend you move to provides its own, if any. |
| Backend storage & query | No | OTel is not a backend — this is where residual lock-in lives. |
The rule of thumb: OTel handles collection (metrics, traces, logs, DogStatsD) and Unified Service Tagging cleanly. Datadog-specific products — NPM, Live Processes, Watchdog, the dashboards and monitors — are not things you “migrate”; you keep them, replace them, or retire them consciously. (For the general version, see what OpenTelemetry can and cannot replace.)
Map the Datadog Agent to OTel
The migration is mostly a component-for-component swap. Everything the Datadog Agent does has an open-standard equivalent:
| Datadog | OpenTelemetry equivalent |
|---|---|
Datadog Agent (metrics, datadog-agent) |
OTel Collector with hostmetrics + prometheus receivers |
Trace Agent / APM libraries (dd-trace) |
OTLP receiver + OTel SDK, or keep dd-trace and ingest it with the datadog receiver |
Log collection (logs_config) |
filelog / journald receivers |
| DogStatsD | statsd receiver |
| Agent integrations / checks | prometheus receiver (scrape) + OTel receivers |
Unified Service Tagging (env/service/version) |
resource processor → deployment.environment.name, service.name, service.version |
| Datadog backend | datadog exporter — or any OTLP backend |
The last row is the escape hatch. The OTel Collector’s datadog exporter writes
straight into Datadog, so you can put OpenTelemetry underneath your whole pipeline
while Datadog keeps working exactly as before. Adoption first; backend decision later.
Two Datadog-specific details will bite if you skip them. APM libraries: Datadog’s
tracers (dd-trace) emit Datadog’s own span format, not OTLP — either move to OTel
SDKs, or keep dd-trace and let the Collector’s datadog receiver ingest its traffic
(DD_TRACE_OTEL_ENABLED only switches the in-process API to OpenTelemetry; the export
stays Datadog-format). Either way, check that service, operation, and resource
names still match what your dashboards key on. Metric naming: Datadog metric names
(system.cpu.user) differ from OTel semantic conventions
(system.cpu.utilization with attributes). The datadog exporter maps many, but
custom dashboards and monitors that reference exact metric names may need updating —
audit your top monitors before cutover, not after.
Step 1 — Replace the Agent with a collector, still feeding Datadog
Deploy an OTel Collector next to (or in place of) the Datadog Agent, configured to export to Datadog. Users see no difference; the collection layer is now open.
receivers:
  otlp:
    protocols:
      grpc:
        endpoint: 0.0.0.0:4317
      http:
        endpoint: 0.0.0.0:4318
  hostmetrics:
    collection_interval: 30s
    scrapers: { cpu: , memory: , disk: , network: , load: }

exporters:
  datadog:
    api:
      key: "${DD_API_KEY}"

service:
  pipelines:
    metrics:
      receivers: [otlp, hostmetrics]
      exporters: [datadog]
    traces:
      receivers: [otlp]
      exporters: [datadog]
Step 2 — Dual-ship to Datadog and a candidate
Add a second exporter and send the same telemetry to a candidate OTLP backend. Now you can compare dashboards, monitors, and APM traces on live data, with Datadog still the system of record. This is the parallel run that makes the migration safe.
exporters:
  datadog:
    api:
      key: "${DD_API_KEY}"
  otlphttp/candidate:
    endpoint: "https://backend.internal:4318"

service:
  pipelines:
    metrics:
      receivers: [otlp, hostmetrics]
      exporters: [datadog, otlphttp/candidate]
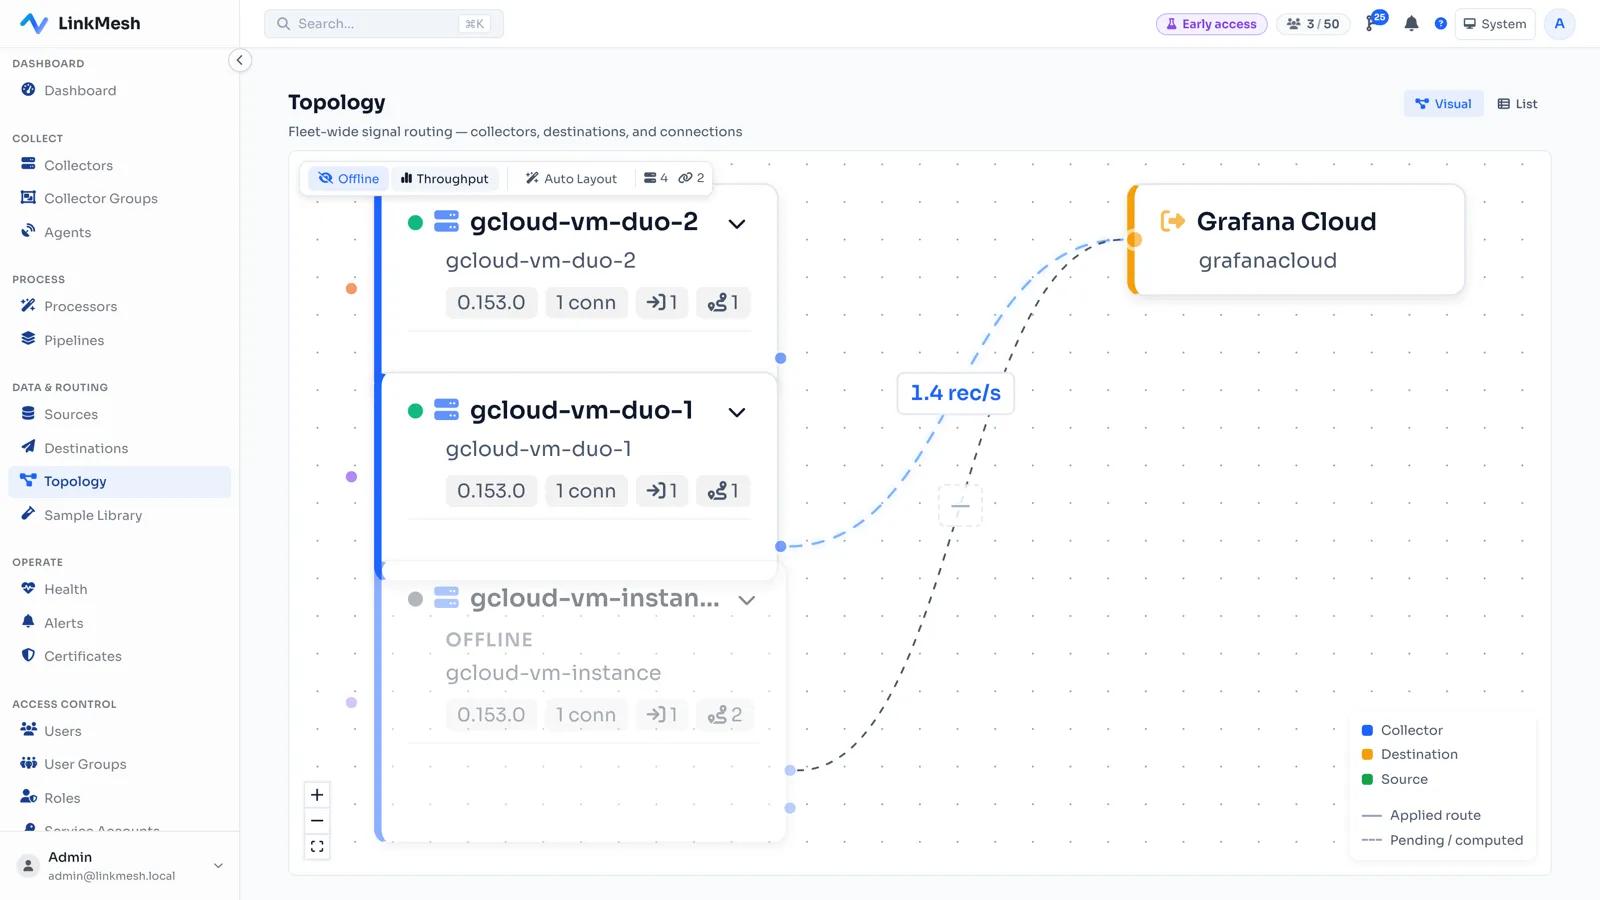
The topology canvas below shows exactly this shape — one stream fanned out to multiple backends, with live per-edge throughput so you can see what each destination is actually receiving:
Step 3 — Attack the bill where it actually grows
Datadog’s cost has three main drivers, and an OTel Collector gives you a lever on each:
- Log ingest (per GB) & indexing (per event). Filter debug logs, health-check spam, and chatty success events at the collector, before they’re ingested. This is the biggest, safest cut — often more than half the log volume.
- Custom metrics (per-series billing). Metrics cost is a cardinality game: every unique tag combination is a billable time series, and one high-cardinality tag (a user ID, a request ID, a raw URL) can explode your bill. Drop or aggregate runaway labels at the collector before they multiply.
- Per-host infra. Consolidating collection and routing only what each backend needs trims what you send per host.
processors:
  # Drop sub-INFO logs before they're ingested
  # (also matches logs with UNSET severity — parse severity first, or add
  # 'severity_number != SEVERITY_NUMBER_UNSPECIFIED' to keep unparsed logs)
  filter/drop_debug:
    logs:
      log_record:
        - 'severity_number < SEVERITY_NUMBER_INFO'
  # Strip a high-cardinality tag that explodes custom-metric series
  attributes/drop_cardinality:
    actions:
      - key: request_id
        action: delete
Every record dropped and every runaway series pruned is money that never reaches the meter. The full method — measure, filter, sample, route — is in how to reduce observability costs. You can also mask PII before egress, which shrinks payloads and keeps sensitive fields out of a third-party backend at the same time.
Step 4 — Manage the fleet and see the savings
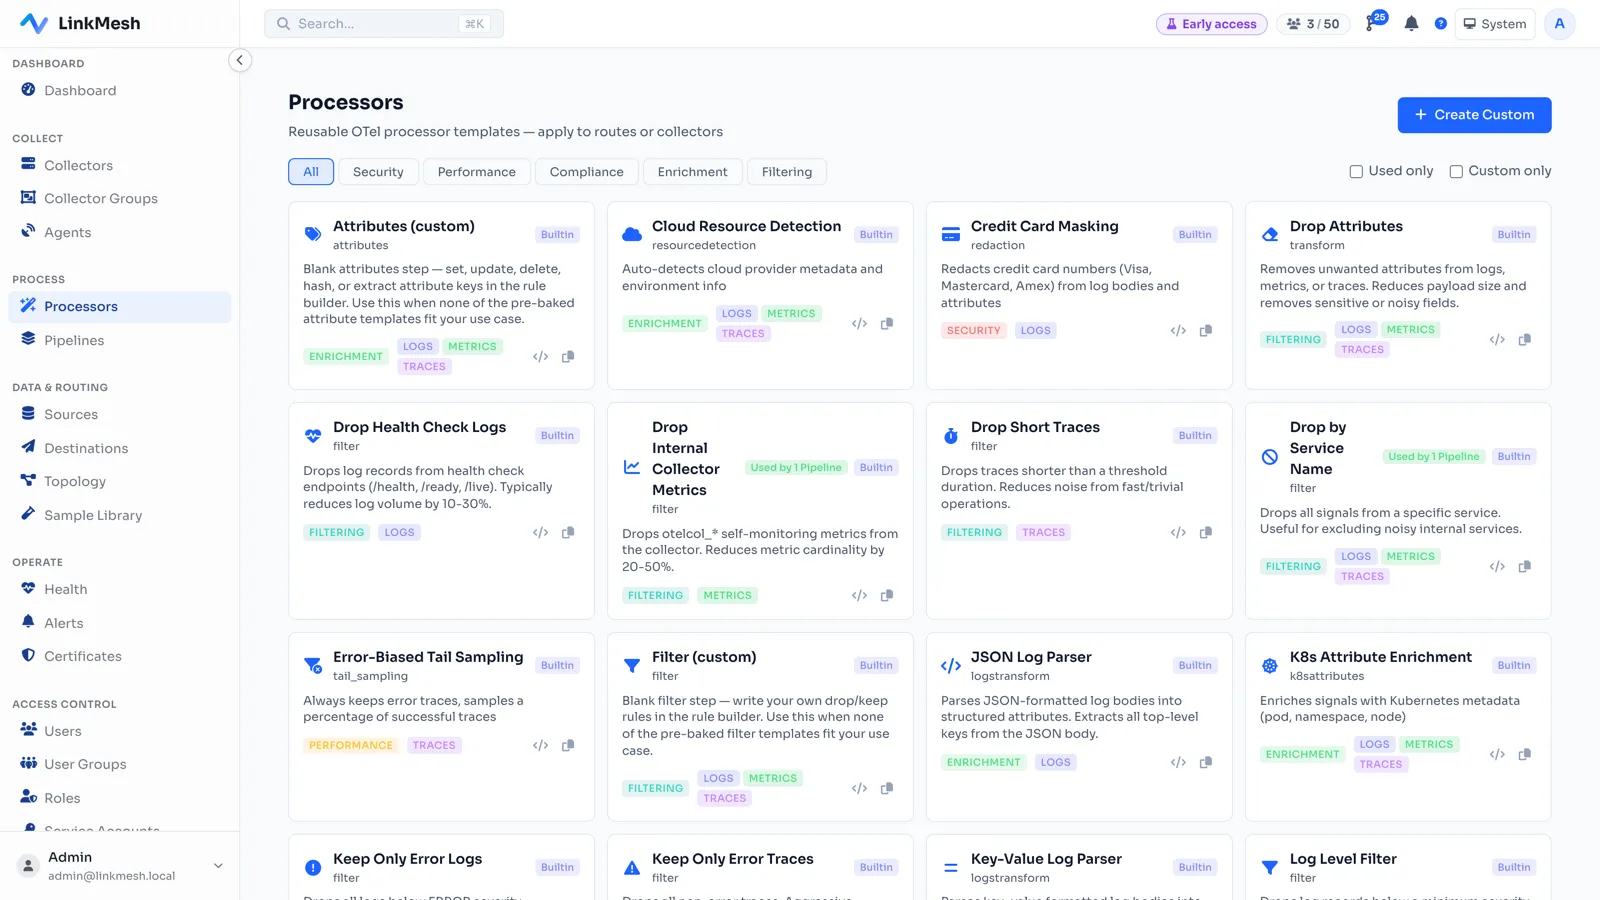
Replacing the Datadog Agent with raw OTel Collectors means losing Datadog’s fleet management and Fleet Automation. Don’t regress there. Manage the collectors from a control plane built on OpAMP: LinkMesh is a self-hosted one that lets you build sources, processors, and routes in a visual UI, validates the config, and pushes it to the right nodes — with per-edge throughput so the volume you just cut is a number you can point at, not a hope.
And the economics have to make sense: a tool you adopt to escape volume pricing shouldn’t bill by volume itself. LinkMesh is priced per managed collector, not per host or per gigabyte — so every gigabyte you stop sending is pure savings on the backend bill and never raises the cost of the pipeline. The telemetry flows straight from your collectors to your backend and stays on your infrastructure; the control plane only manages config.
Validate parity — and watch the double-billing window
Dual-shipping to Datadog and a candidate means you’re paying for both during the overlap, so validate briskly and keep the window short. The checklist:
- Metrics — compare key metrics and, critically, custom-metric counts between Agent and OTel. A cardinality difference changes what you’re billed for.
- Traces — confirm service names, operation/resource names, and span structure
match what your APM dashboards and monitors key on (this is where
dd-tracevs OTel SDK naming differences surface). - Logs — verify parsing,
env/servicetags, and log-to-trace correlation survived the move from Datadog log pipelines to Collector processors. - Unified Service Tagging — check
env,service, andversionare present as resource attributes so filtering behaves as before. - Monitors — re-point your highest-priority monitors at the OTel-fed data and confirm they still trigger; watch for monitors that reference exact Datadog metric names.
- Dropped telemetry — check the Collector’s internal metrics for refused/dropped data, so a filter isn’t silently eating signal.
- Cost — confirm the reduced stream actually lowered ingested volume and custom series, and that you’re not accidentally doubling host counts by running Agent and Collector on the same hosts during overlap.
Have a rollback plan
- Keep the Datadog Agent (or the
datadogexporter path) live until the candidate passes validation for an agreed period. - Independent exporters — Datadog and the candidate are separate blocks; drop or restore either without touching the other.
- Define success thresholds — metric/trace parity, priority monitors firing, volume down by the expected amount — before you remove anything.
- Mind the meter during overlap — dual-shipping to Datadog costs money; set a deadline for the comparison so the double-billing window doesn’t drift.
- Decommission after an observation period, not at first green.
Step 5 — Decide about Datadog on your terms
Here’s the important part: once you’re on OTel, you don’t have to leave Datadog at all. Plenty of teams keep Datadog for APM or a subset of critical services and route the rest — cheap-to-store logs, archival telemetry — to an OTLP backend or object storage. The point of the migration isn’t necessarily “quit Datadog”; it’s to make staying or leaving a choice rather than a captivity.
If you do cut over, it’s an exporter change, not a re-instrumentation project. Your data is OTLP, your fleet is on OpAMP, and the next backend decision is one config block away.
The migration in five moves
- Replace the Agent — deploy OTel Collectors exporting to Datadog via the
datadogexporter. Nothing changes for users. - Dual-ship — add a candidate OTLP backend and compare on live data.
- Cut volume — filter logs, prune high-cardinality metrics, and sample at the collector to attack the three cost drivers directly.
- Validate & keep rollback — work the checklist, watch the double-billing window, keep the Agent as a safety net.
- Decide — keep Datadog for what it’s worth to you, route the rest elsewhere, or cut over entirely. On OTLP, it’s your call.
The Datadog Agent was the collection-layer lock-in and the bill was the symptom. Move collection to OpenTelemetry and both become things you control — while you keep, in Datadog, whatever analytics still earn their place.
The hard part is running the fleet through the cutover without config drift or double-counted hosts. LinkMesh is a self-hosted OpAMP control plane that builds, validates, previews, and audits collector config — with per-edge throughput so you can prove the volume (and cost) you cut. Priced per collector, not per GB. Stand one up in minutes, or see what it does.