

 LinkMeshObservability Data Collection Management
Your Logs Aren't JSON. That's Fine.
Fold multiline stack traces into one event and parse just enough to query them — without rewriting your apps.
 Roman Hüsler← Back to blog
Most guides about “structured logging with OpenTelemetry” quietly assume you
already emit clean JSON with a level field and a trace_id. Real systems
don’t. You have a decade of services logging plain text, a framework that
prints stack traces across 30 lines, and at least one component whose format
nobody remembers choosing. You can’t rewrite all of it, and you shouldn’t have
to just to get your logs into a pipeline.
The good news: OpenTelemetry doesn’t require any of that structure. A log line is a log record whether or not it’s JSON. The work isn’t reformatting your apps — it’s onboarding the mess as it is, taming the one thing that genuinely breaks (multiline entries), and parsing only what you actually need to query.
Raw is fine: non-JSON is not non-OTel
The OpenTelemetry Collector’s filelog receiver tails a file and turns each
line into a log record, putting the whole line in the record’s body. No
schema, no parsing, no cooperation from the application required. A line like:
2026-07-17T09:14:22Z ERROR checkout-api order 8821 failed: NullPointerExceptionbecomes a log record whose body is exactly that string. That’s already
enough to ship it, search it, and keep it. Structure is something you add
where it pays off — not a precondition for getting started.
In LinkMesh you add this as a File Tail source: point it at a path (or a
glob like /var/log/app/*.log), and it renders the filelog receiver for you.
The multiline trap
Here’s where naive log onboarding falls apart. A stack trace is one event to a human and 30 events to a line-oriented reader:
2026-07-17T09:14:22Z ERROR checkout-api NullPointerException processing order 8821
    at com.acme.checkout.OrderService.total(OrderService.java:88)
    at com.acme.checkout.OrderService.submit(OrderService.java:41)
Caused by: java.lang.NullPointerException
    at com.acme.pricing.Rules.apply(Rules.java:203)
    ... 14 more
Tail that with a default config and you get one record for the header and one
record per at ... line — 30 disconnected fragments. Your “error rate” metric
counts one incident as thirty. The message that matters (the Caused by:) is
severed from the exception it explains. Alerting on it is hopeless.
Fix it: match the entry start, fold the rest
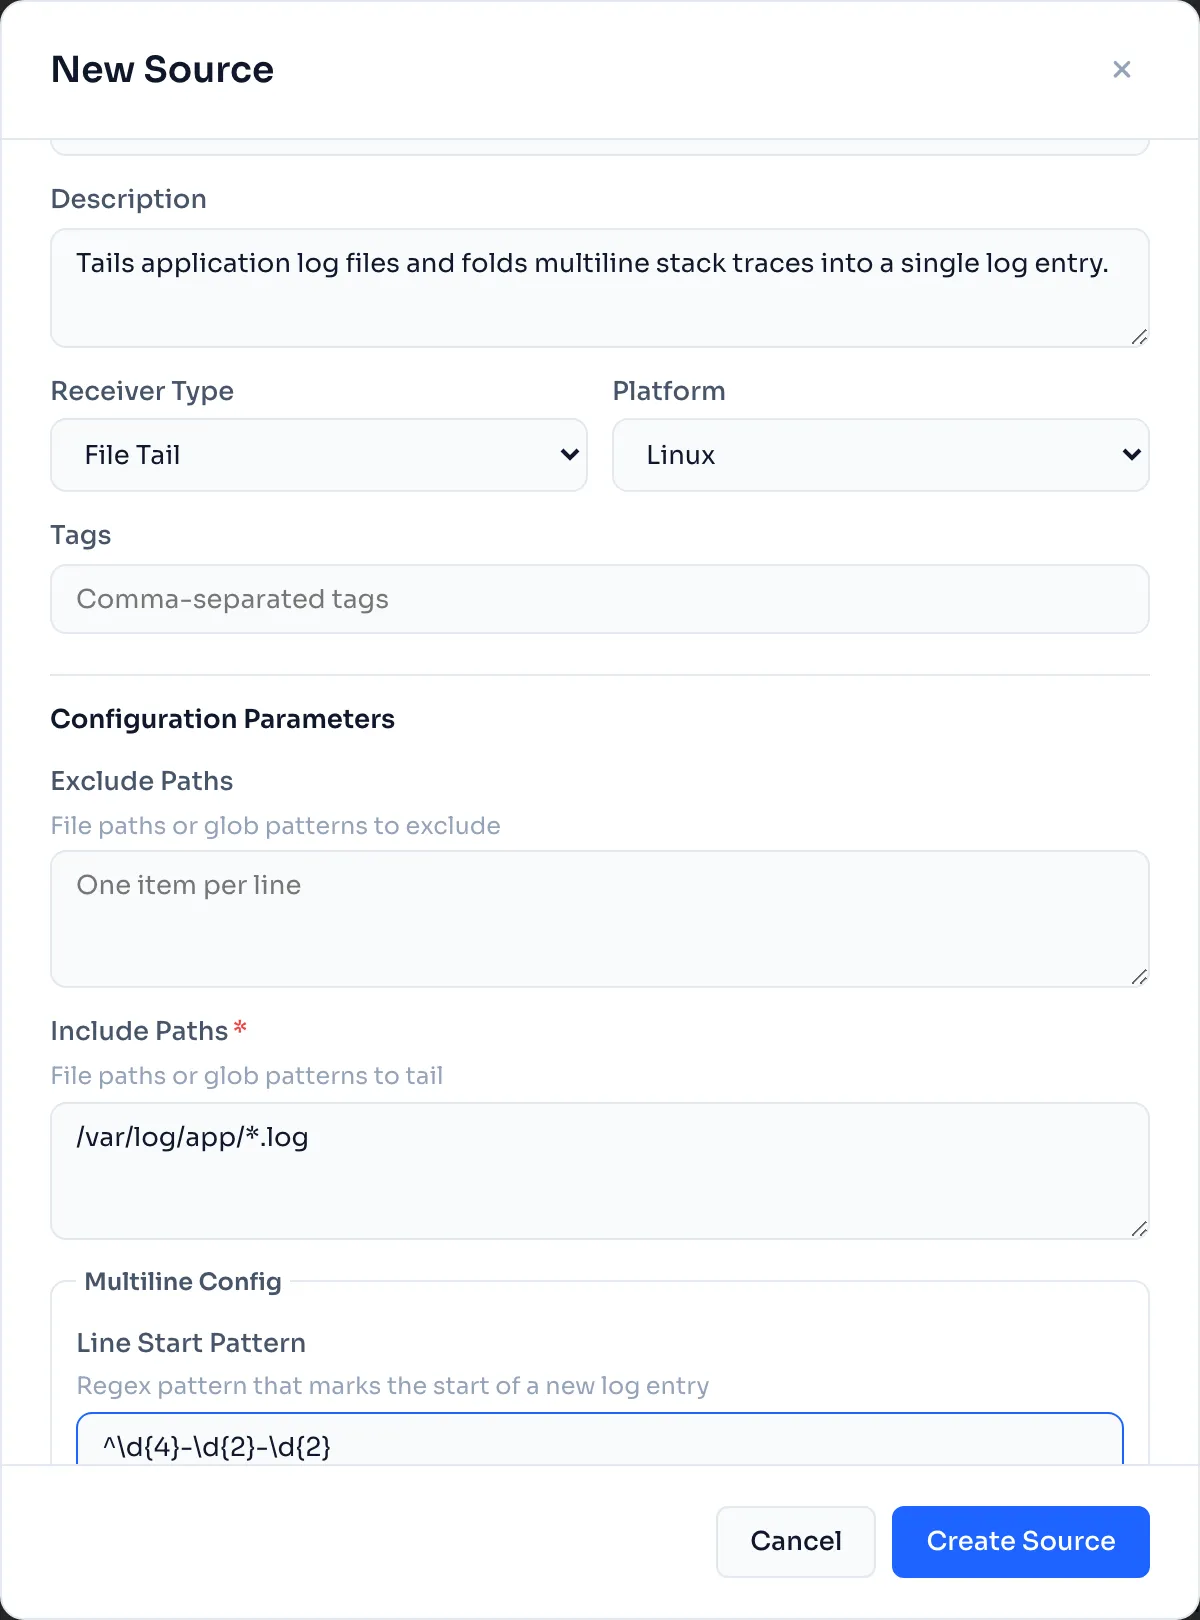
The fix is a single idea: tell the receiver where a new entry begins, and treat everything else as a continuation of the previous one. Every entry in the example above starts with a timestamp, so a start-of-entry pattern matching the timestamp does it:
multiline:
  line_start_pattern: '^\d{4}-\d{2}-\d{2}'
Now the header line and its 29 continuation lines fold into one log record
whose body holds the entire stack trace. One event in, one event out — your
error rate is honest again and the Caused by: travels with its exception.
In LinkMesh you set this on the File Tail source — a single field — and the sample viewer confirms it: the whole trace shows up as one record, not a shredded pile.
Parse only what you need — and keep the raw body
With the event intact, you usually want just enough structure to query and
route: a severity level, maybe a service or an error class. You don’t need to
fully “structure” a stack trace — you need level=ERROR as an attribute so you
can filter and alert on it.
A transform processor (OTTL) does this without touching the raw body. Derive the level from the content:
set(attributes["level"], "ERROR") where IsMatch(body, "(?i)error|exception")
set(attributes["level"], "WARN")  where attributes["level"] == nil and IsMatch(body, "(?i)warn")
set(attributes["level"], "INFO")  where attributes["level"] == nil
The body stays exactly as it arrived — nothing is lost — and you gain a clean
level attribute to filter, route, and alert on.
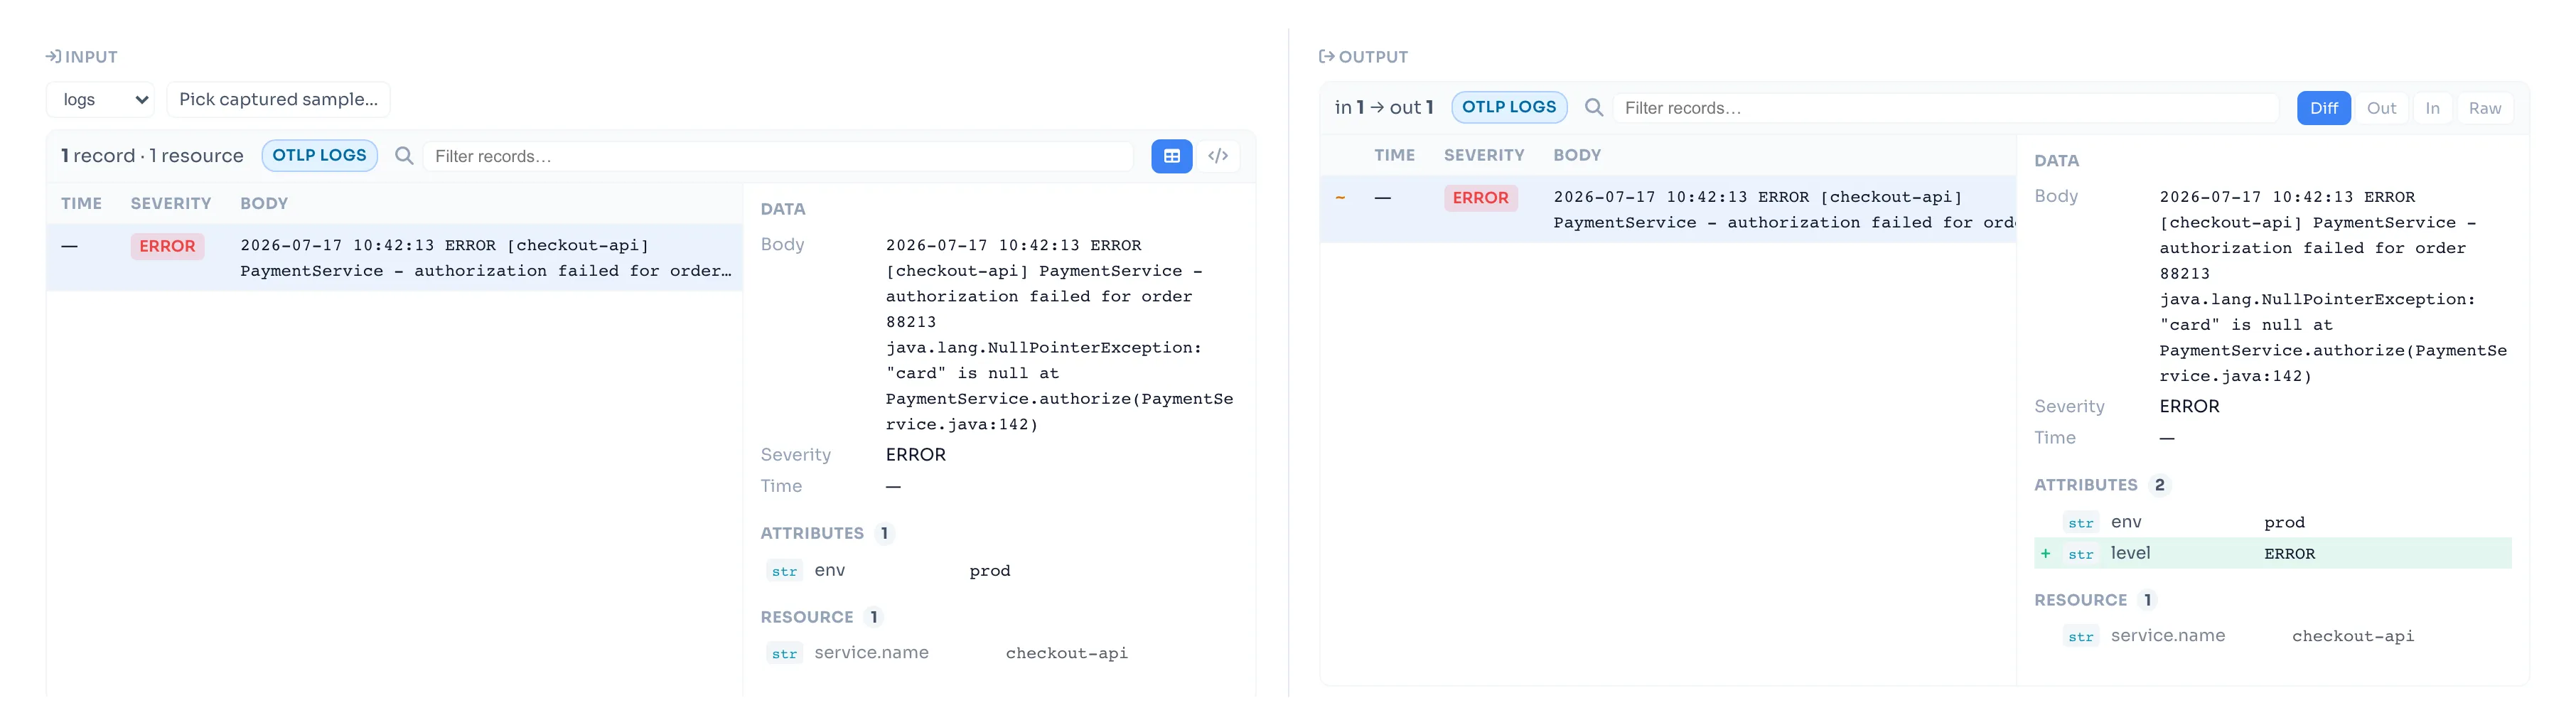
The trap with any transform is writing it blind: a slightly-wrong condition and
you’ve mislabelled everything, and you find out in production. LinkMesh’s
dry-run preview closes that loop. Open the transform step, feed it a real
multiline record, and watch input and output side by side — the input has no
level, the output has level = ERROR, added and highlighted. You see the
extraction actually happen before you save it.
Ship it: one entry per event, queryable by the parsed field
Point the pipeline at a Grafana Cloud Logs (Loki) destination and the whole
multiline event lands as a single Loki entry — the full stack trace intact in
the body, with your parsed level available to filter on. A LogQL query for
errors returns whole incidents, not header-line fragments:
{service_name="checkout-api"} | level = "ERROR"otelcol or Alloy — same result
LinkMesh manages collectors on two runtimes — the OpenTelemetry Collector
(via OpAMP) and Grafana Alloy (via remotecfg) — and the multiline log path
works the same on both. You configure the File Tail source and the transform
once; LinkMesh generates the right config for whichever runtime each collector
runs. The stack trace folds into one event and the level extraction applies
identically, so you’re not locked into one agent to get clean logs.
The point
You don’t structure your way into OpenTelemetry — you onboard the logs you have, fix the one thing that actually breaks (multiline), and parse the one or two fields that make them queryable. Raw stays raw, the incident stays whole, and you can see every transformation before it touches production.