

 LinkMeshObservability Data Collection Management
Dual-Shipping Without Duplicates
Send to two backends at once — count it once.
 Roman Hüsler← Back to blog
Every careful observability migration goes through a phase where telemetry flows to two backends at the same time: the incumbent you’re leaving and the OpenTelemetry stack you’re moving to. It’s the right thing to do — it’s how you prove parity before you turn anything off. But it’s also where the bill quietly doubles and, worse, where the two systems start disagreeing about basic numbers because one of them is counting the same data twice.
Dual-shipping (sometimes “dual-write” or “shadow shipping”) is simple in principle and full of traps in practice. This guide is about doing it cleanly: one pipeline, two exporters, no double-counted hosts, no duplicated logs, and a clear signal for when the overlap window should end.
Platform engineers and SREs running a migration or backend evaluation who need both systems live long enough to compare them — without inflating host counts, doubling metric volume, or paying twice for the privilege. Prerequisites: an OpenTelemetry Collector in the path (or a plan for one) and two destinations you want to compare.
Why dual-ship at all
There are only a few good reasons to run two backends in parallel, and they’re all about de-risking a change:
- Migration validation. Before you trust the new stack, you want to see the same dashboards, the same alert thresholds, and the same numbers in both places. Parity you can watch beats parity you assume.
- Gradual cutover. Move dashboards and alerts to the new backend a few at a time while the old one still works, so a gap in the new setup never means you’re blind.
- Backend evaluation. Comparing two destinations honestly means feeding them identical input over the same window, not two different samples.
The common thread: dual-shipping is a temporary, deliberate state that exists to build confidence, then ends. Treat it as permanent and it becomes twice the cost and twice the operational surface for no ongoing benefit. For the strategic framing of the migration itself, see what OpenTelemetry can and cannot replace and the Datadog and Splunk Enterprise playbooks.
The traps: how dual-shipping double-counts
The danger isn’t sending to two places. It’s sending the same signal through two independent collection paths, so each backend — and often your billing — sees it twice.
- Two agents on one host. The classic mistake: leave the old vendor agent running and deploy a collector on the same host, both emitting host metrics. Now every host reports itself twice. Backends that bill per monitored host count that host twice, and your infrastructure dashboards show double the fleet.
- Metrics counted twice. If both paths scrape the same Prometheus endpoint or both
emit
hostmetrics, cumulative counters and gauges are ingested twice. Rates look right within each backend but volume (and cost) is doubled, and any cross-backend reconciliation is off by 2×. - Logs duplicated. Two log agents tailing the same file ship every line twice. If they later merge — say both forward to a shared Kafka topic or a single index — you get duplicate log events that break counts and dedup-sensitive alerts.
- Traces fanned out wrong. Sending spans through two separate SDK export paths can produce two copies of the same trace with different resource attributes, so span counts and service maps disagree between backends.
The root cause in every case is two collection paths for one source. The fix is one path that fans out at the end.
Dual-ship cleanly: one pipeline, two exporters
The OpenTelemetry Collector is built for exactly this. Collect each source once, process it once, and then fan out to two exporters at the tail of a single pipeline. Same data, same processing, delivered to two destinations — counted once because it was collected once.
receivers:
  hostmetrics:
    collection_interval: 30s
    scrapers:
      cpu:
      memory:
      filesystem:
      network:

processors:
  resourcedetection:
    detectors: [env, system]
  batch:
    send_batch_size: 8192
    timeout: 5s

exporters:
  # Incumbent backend (leaving)
  datadog:
    api:
      key: ${env:DD_API_KEY}
  # New OpenTelemetry-native backend (arriving)
  otlphttp/grafana:
    endpoint: https://otlp-gateway.example.net
    headers:
      # Grafana Cloud expects Basic auth: base64(instance_id:api_token)
      authorization: "Basic ${env:GRAFANA_OTLP_AUTH}"

service:
  pipelines:
    metrics:
      receivers: [hostmetrics]
      processors: [resourcedetection, batch]
      exporters: [datadog, otlphttp/grafana]
The key line is exporters: [datadog, otlphttp/grafana]. One receivers list, one
processors list, two exporters. The host is scraped once, so it counts once; the
metrics are batched once, so volume is identical on both sides; and every record that
reaches one backend reaches the other, which is what makes the comparison valid.
Avoid the metric double-count
The single most expensive mistake is running the old agent and the collector side by side, both emitting the same host metrics. Don’t. Pick one collection agent per host and let it fan out. Concretely:
- Retire the old agent’s metric collection when the collector takes over. If you need the incumbent backend to keep receiving host metrics during the overlap, send them from the collector’s exporter — not from a second agent.
- One scrape per Prometheus target. If the collector scrapes a target, don’t also
scrape it from a legacy Prometheus. Two scrapers on one
/metricsendpoint double the series. - Tail each log file from one agent only. Move
filelogcollection into the collector and stop the old log shipper on that path, so no line is read twice.
You can route destination-specific differences (a backend needs different resource
attributes, or one wants only errors) with the filter processor or the routing
connector — still fed by the single collection path — so you don’t need a second
collection agent to send different data to each backend.
Keep the overlap window short
Dual-shipping is a cost multiplier and an operational tax while it runs: two sets of egress, two bills, two things to keep healthy. The point is to gather enough evidence to trust the cutover, not to run both forever. Discipline here:
- Set the window before you start. “Two weeks, covering one full billing cycle and one on-call rotation” is a plan. “Until we feel good” is not.
- Define parity explicitly. Which dashboards, which alerts, which numbers must match within what tolerance. Write the checklist first.
- Cut over one signal at a time. Metrics may reach parity before logs. Stop dual-shipping a signal the moment its checklist is green, rather than waiting for all three.
Deciding when to stop
You’re done dual-shipping a signal when the new backend reproduces the dashboards and alerts you actually use during an incident, the numbers reconcile within tolerance, and your team reaches for the new backend by reflex. At that point, remove the incumbent exporter from the pipeline, confirm the new backend still receives everything, and only then decommission the old agent and stop paying for the old ingest. Leaving the second exporter in “just in case” is how a temporary overlap becomes a permanent double bill — and the cost work in reducing observability costs is undone before it starts.
Because the whole point of the exercise is confidence, it helps to see both routes carrying the same volume. If per-edge throughput on the two exporters tracks each other, you know the fan-out is faithful; if one lags, you’ve found a delivery problem before it becomes a parity mystery.
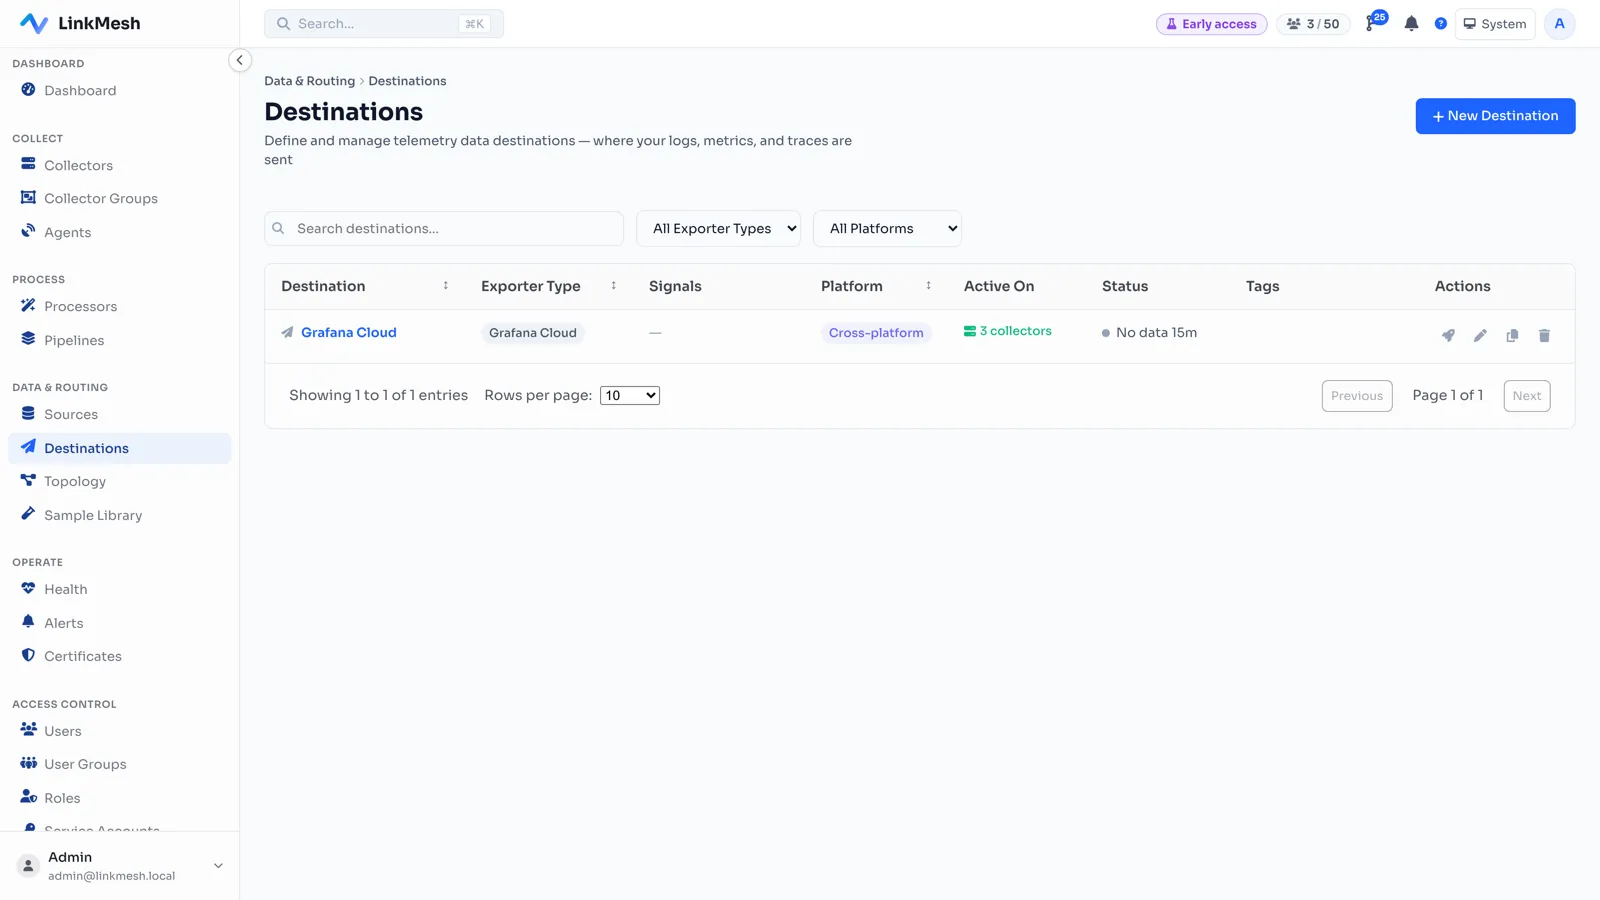
LinkMesh composes one validated pipeline and fans it out to multiple destinations — Grafana Cloud, Loki, Prometheus, Datadog, Kafka — from a single collection path, with per-edge throughput on every route so you can confirm both backends see the same volume. Self-hosted, priced per collector. Stand one up in minutes, or see what it does.