

 LinkMeshObservability Data Collection Management
OTel Collector Onboarding
Getting data in is the other half of fleet management — and everything before the config file exists.
 Philippe Braxmeier← Back to blog
Every conversation about managing an OpenTelemetry collector fleet is a conversation about pushing configuration out: one control plane, many collectors, change the config in one place and watch it land everywhere. That problem is well understood and, as of 2026, well served — by us and by several other people.
It is also only half the job. The other half is OTel collector onboarding: working out what a host actually has to offer, what those log lines look like, what a pipeline will do to them, and whether anything arrived. That half rarely appears in a feature matrix, and it is where the hours go.
TL;DR — Config-out and data-in are two different axes, and most fleet management tools only address the first. On the config-out axis, Grafana Fleet Management and LinkMesh do broadly the same thing. On the data-in axis they work differently: Grafana’s model expects a configuration you have already authored and assigns it by attribute matching, while LinkMesh inspects the host first, samples the real file, previews the pipeline’s effect on those samples, and generates the configuration from what you picked. If you already know exactly what is on every host, the difference is small. If you don’t, it is most of the work.
Fleet management solves the second half first
Here is the shape of the problem, in the order you actually meet it:
- A host exists, and something on it produces telemetry.
- You find out what, and where.
- You work out what the data looks like, and what you want done to it.
- You write a collector configuration that says so.
- You get that configuration onto every collector that needs it, and keep it current.
Fleet management — ours included — is very good at step 5. Central config push, version history, attribute-based targeting, health and throughput monitoring: that is a solved category, and we have written about why the interesting question there is where the control plane runs rather than what it does.
Steps 2 through 4 are a different problem, and they do not get easier because step 5 got solved. They get more visible, because once rollout is instant, the week you spent working out what to roll out is the whole remaining cost.
What OTel collector onboarding actually costs
Onboarding one host you built yesterday is trivial. Onboarding four hundred hosts, a third of which predate everyone currently on the team, is not — and the cost is not in the YAML. It is in the questions the YAML assumes you have already answered:
- Which files on this box are logs, as opposed to the thing that rotates them, the archive of last quarter, and the 4 GB file nobody has read since 2023?
- Is this application’s log one event per line, or one event per stack trace spread over thirty?
- If I put this through the parsing pipeline we use for the other Java services,
does it come out right, or does it come out as four hundred thousand records
with an empty
body? - Once I turn it on, is anything actually arriving?
The traditional answer to all four is: guess, deploy, read the collector’s own logs, adjust, deploy again. That loop is slow in a way that does not show up on any architecture diagram, and it gets slower the less you know about the estate — which is exactly the case where onboarding matters most.
Two models: authored config, or an onboarding workflow
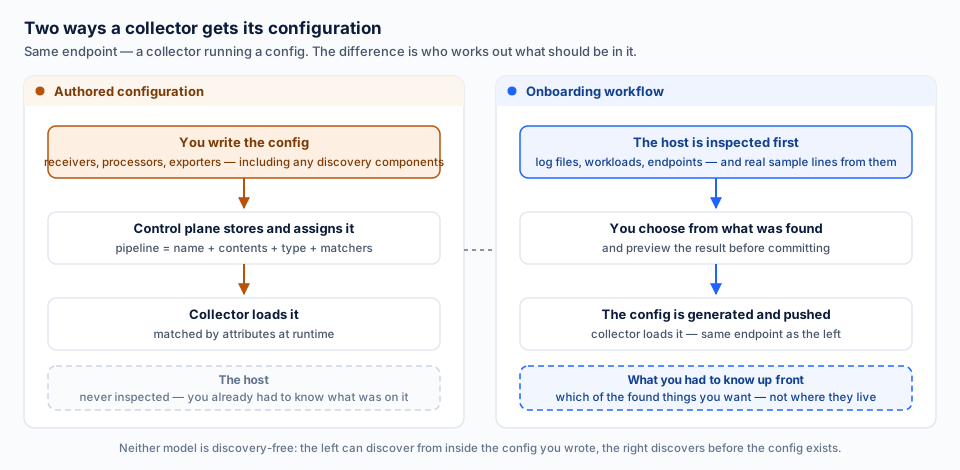
The distinction worth drawing is not “has discovery” versus “has no discovery”. That framing is wrong, and it is worth being precise about why.
Grafana’s model. Alloy ships genuine discovery components — discovery.kubernetes,
discovery.docker, discovery.relabel and friends — and they do real work at
runtime. But they are components inside a configuration you wrote. Fleet
Management’s unit of work is the configuration pipeline, and per Grafana’s own
architecture documentation,
pipelines “are composed of a unique name, the components for the collector to
load and run, a configuration type, and a list of matchers that match collectors
with the pipeline.” The Terraform example in their docs
makes the shape plain:
contents = file("config.alloy"). The control plane’s job begins once that file
exists, and its clever part is matching — deciding which collectors receive
which pipeline, by attribute.
That is a good design, and for a fleet of well-understood, homogeneous hosts it is arguably the right one. Discovery-in-config is more expressive than any UI, and it re-evaluates continuously at runtime, which a one-time onboarding step does not.
The onboarding-workflow model. The other approach inverts the order: the control plane looks at the host before the configuration exists, shows you what it found, lets you try a pipeline against real data from it, and then writes the configuration for what you chose. Discovery happens as a control-plane workflow rather than as a runtime component, and its output is a config file you did not have to draft.
Neither model is discovery-free. The difference is when discovery runs and who has to already know the answer.
What that looks like in LinkMesh
Four steps, and the configuration file is the last one.
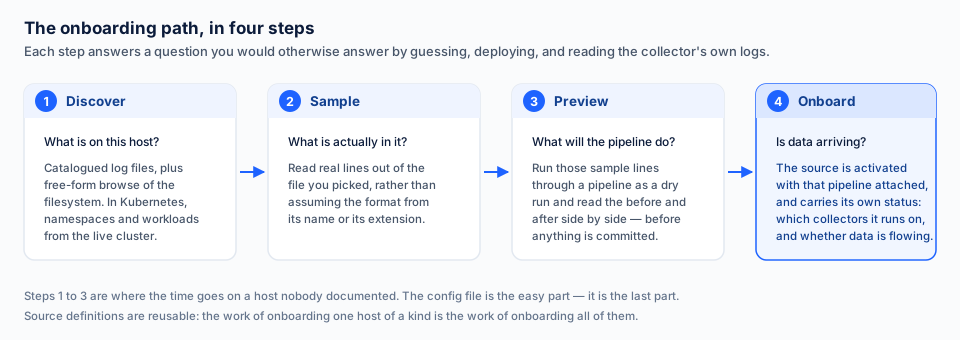
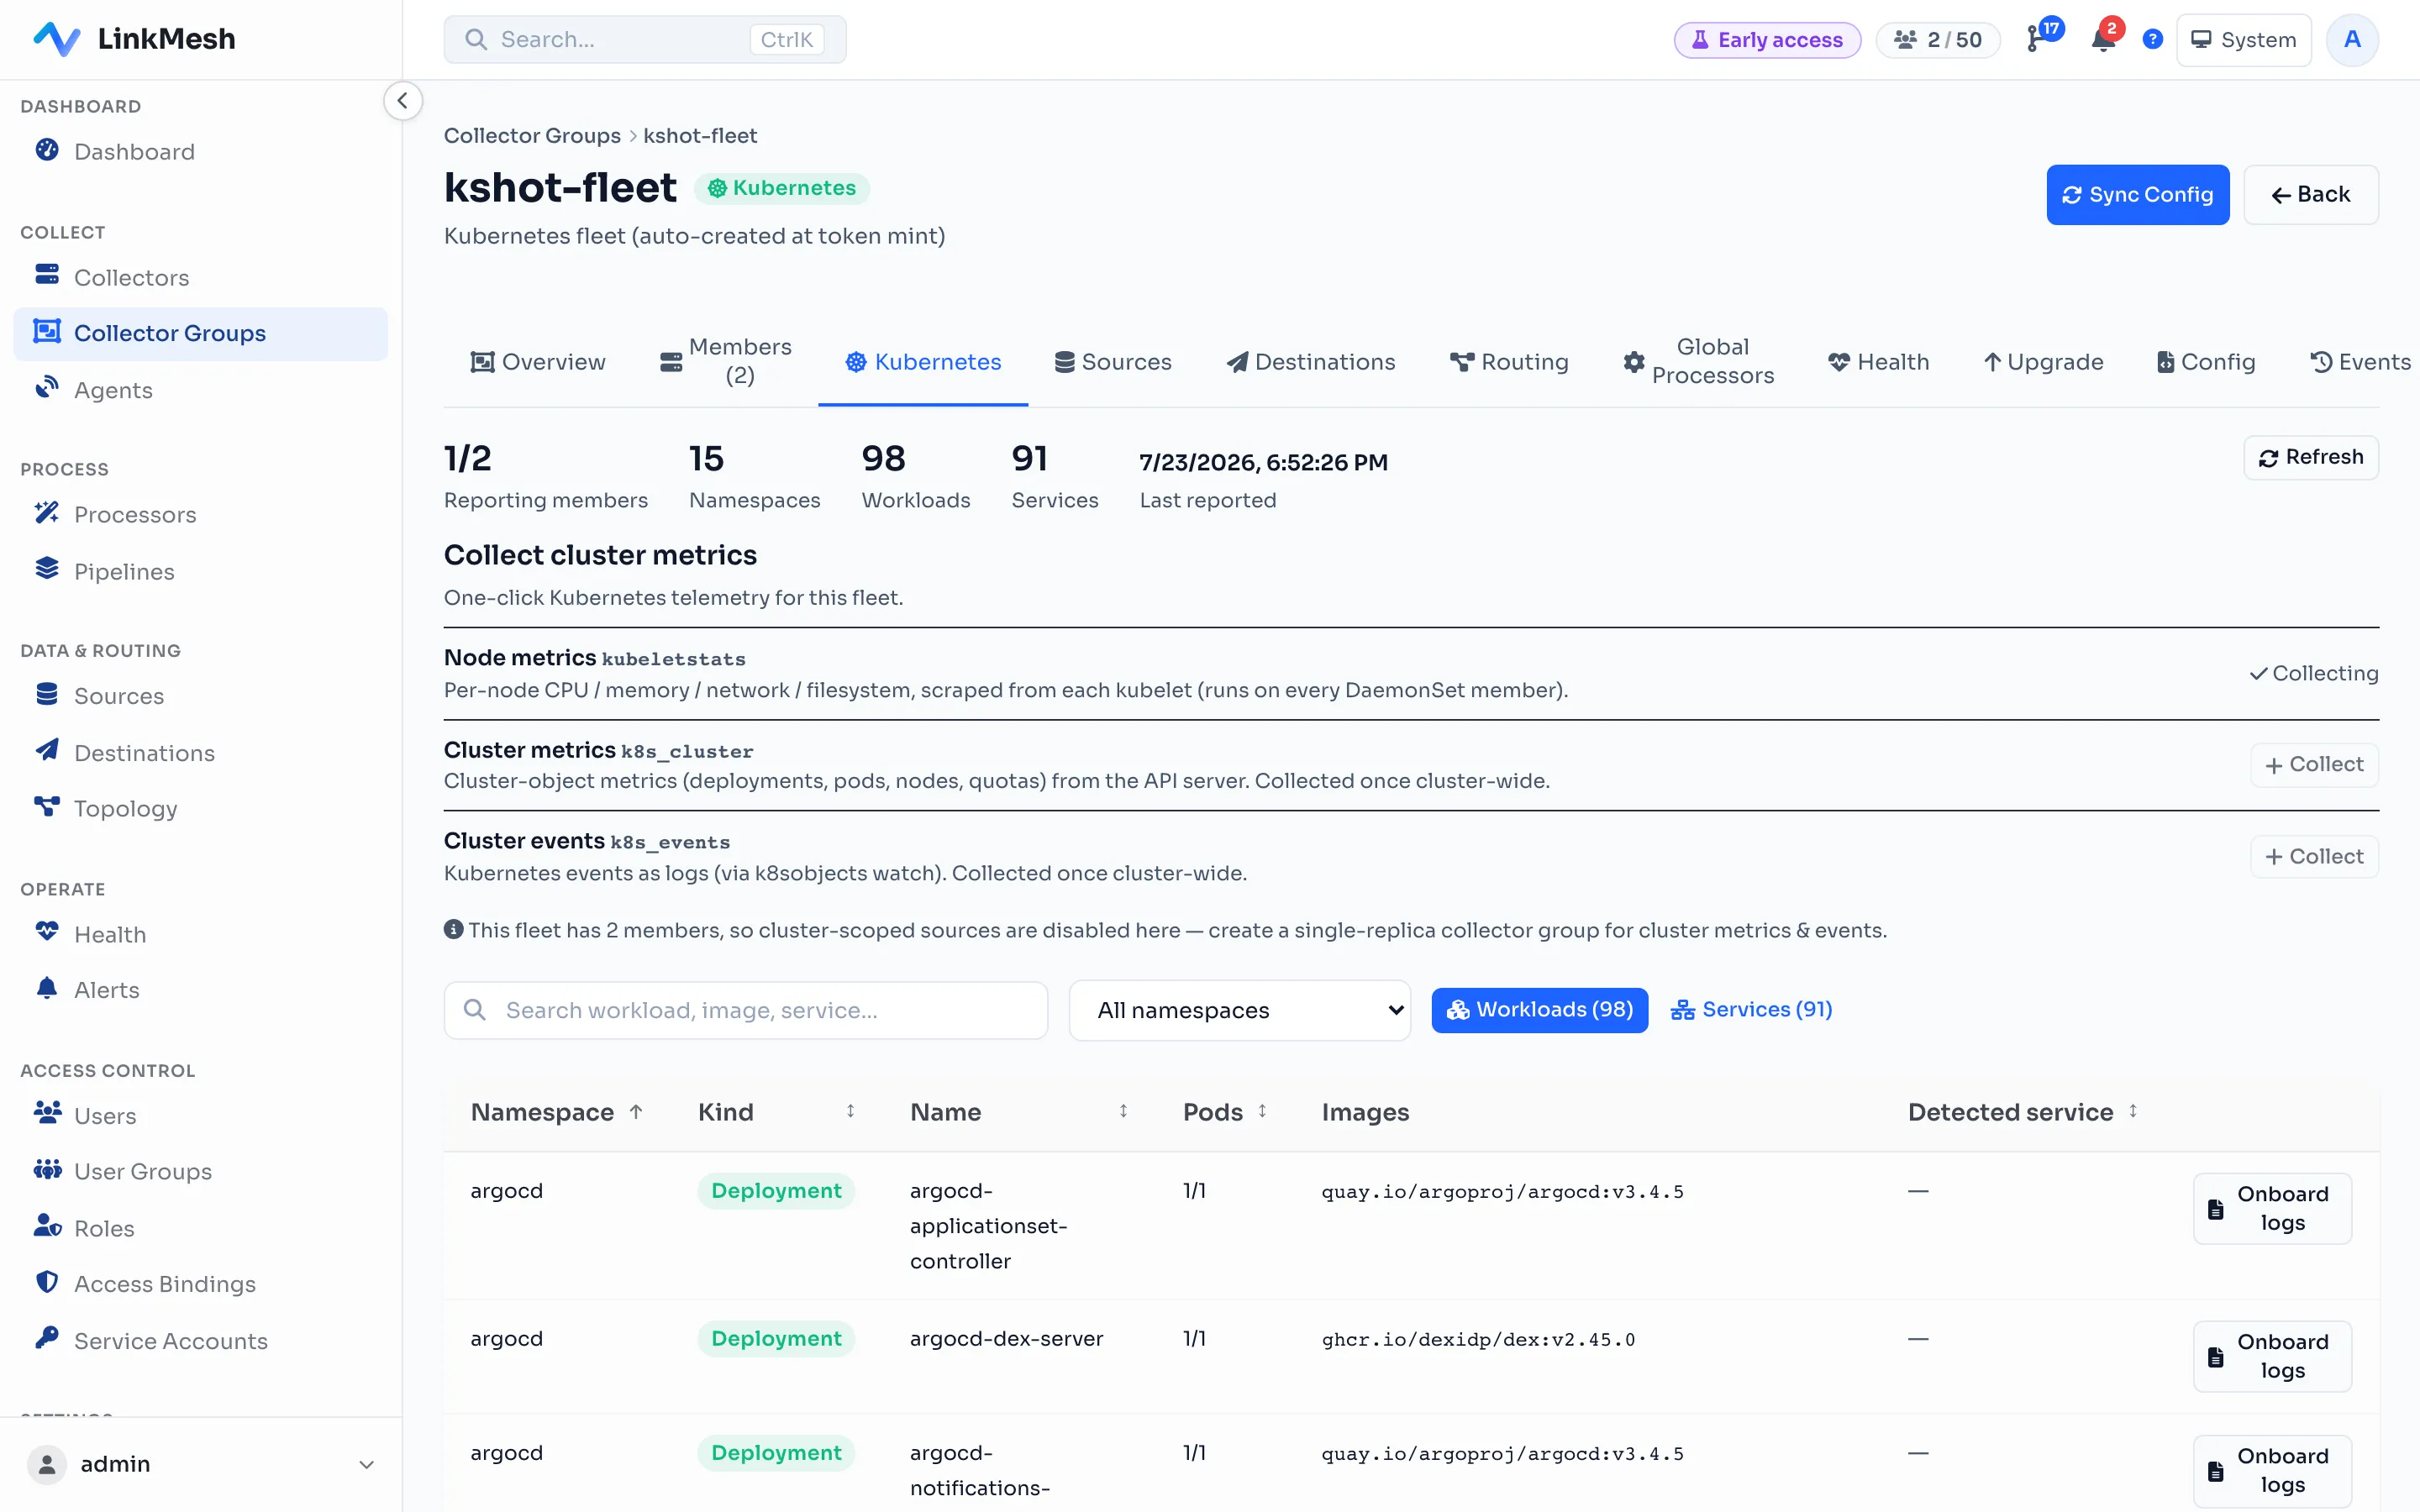
Discover. Browse a host’s log files — both the catalogued ones and a free-form walk of the filesystem, because the file you want is regularly not the file anybody catalogued. On Kubernetes the same step enumerates the live cluster: namespaces, then workloads, then one-click onboarding of pod logs and cluster metrics.
Sample. Read real lines out of the file you picked. This is a small feature that removes a large class of mistake, because the format of a log file is a property of the file, not of its name.
Preview. Take those sample lines, run them through a pipeline as a dry run, and read the before and after side by side. You are looking at your own data transformed by the exact processors that will run in production, before any of it is committed — which answers the “does it come out right” question at the point it is cheap to answer rather than after a deploy. (Once data is flowing, the same inspection is available against live traffic rather than samples.)
Onboard. Activate the source with that pipeline already attached. The source itself is a reusable definition — file tail, syslog, TCP, OTLP, Windows Event Log, Prometheus endpoints — with per-host parameter overrides, so the work of onboarding one host of a kind is most of the work of onboarding all of them. Each source then carries its own status: which collectors it is active on, and whether data has arrived recently. That last column is the one that answers question four, and it is the reason the hero image of this post is a boring table.
Parsing the messy result is a separate craft, and we have written it up separately: folding multiline stack traces into single events and parsing just enough to query them.
Where this model runs out of road
The honest scope of it, because a control plane that names its edges is easier to trust than one that doesn’t:
- Discovery tells you what is there, not what it means. It will find the file and show you its lines. Deciding that those lines are the payment service’s audit log and matter more than the others is still your judgement.
- Sampling reads a bounded slice, not the whole file. A format that appears only in the 0.1% of lines nobody sampled will still surprise you.
- It does not tell you what a source will cost you. There is no volume estimate before you turn something on; you turn it on and then watch throughput.
- Onboarding is a point-in-time workflow, not a continuous one. A host that grows a new log file next month does not onboard itself — which is precisely the case where a runtime discovery component in a config has the advantage.
What we’re not claiming
- Not that Grafana Fleet Management lacks discovery. Alloy’s discovery components are real, they are good, and for Kubernetes in particular they re-evaluate at runtime in a way an onboarding workflow does not.
- Not that this is the axis that decides every evaluation. If your hosts are uniform and well documented, authored configuration is less ceremony, and you should prefer it.
- Not a claim about anyone’s roadmap. Everything described above is in the product today; everything not described is not being promised.
- Not a pricing argument. Grafana Fleet Management is available on a free Grafana Cloud tier, and we do not compete with it on price.
Choosing by which half hurts
Two questions, and you will usually know from the first:
- Do you already know what is on your hosts? If yes — a documented, uniform estate — the onboarding axis is worth little to you, and you should choose on the config-out axis instead, where the deciding question is where your control plane runs.
- Is most of your estate older than your observability practice? If yes, the discover-sample-preview loop is not a convenience feature. It is the difference between onboarding an unfamiliar host in an afternoon and in a fortnight.
The first axis is about where your fleet metadata lives. This one is about how much you have to already know before the tool is useful. They are independent, and a fleet management tool can be strong on one and indifferent to the other.
If the second question is yours, you can point LinkMesh at a host and see what it finds this afternoon — download it and try it, free for the first 25 collectors after a no-card registration in the OpenSight Customer Portal (5 without one), no call to book. For the first axis, see Grafana Fleet Management vs LinkMesh; for the wider picture of what a fleet control plane is for, see OpenTelemetry collector fleet management.
Competitor facts in this post were verified against Grafana’s public documentation on 2026-09-13.