

 LinkMeshObservability Data Collection Management
Observability vs AIOps
Not rivals — both run on the same telemetry foundation.
 Philippe Braxmeier← Back to blog
“Observability” and “AIOps” get thrown around as if you have to choose one, or as if AIOps is the shinier replacement for observability. Neither is true. They answer different questions, they’re used by different teams, and both draw on the same underlying operational data.
Here’s the short version: observability is how engineers explore telemetry to understand systems. AIOps applies machine learning to operational data to detect, correlate, predict, and automate. They’re not two ends of one spectrum — they’re two consumers of a shared foundation. This guide draws the line clearly, shows which teams work at which layer, and explains why the pipeline underneath both decides how useful either one is.
What observability actually means
Observability is the ability to understand a system’s internal state from the telemetry it emits — primarily metrics, logs, and traces (and, increasingly, profiles) — well enough to answer questions you didn’t know to ask in advance (“unknown unknowns”). In practice it’s two things:
- The telemetry — metrics (is it slow?), logs (what happened?), and traces (where, across which services?), collected from every host and service.
- The tools to explore it — dashboards, queries, and trace views where a human investigates: filter, pivot, drill down, correlate.
Observability is often human-driven and exploratory: engineers use telemetry to investigate unfamiliar conditions and understand behaviour. Modern observability platforms also automate detection, correlation, and analysis — so the line with AIOps isn’t perfectly sharp. (For the anatomy of how that telemetry is collected and shipped, see what is a telemetry pipeline?.)
What AIOps actually means
AIOps — “AI for IT Operations” — applies machine learning and statistics to operational data and workflows, to do at scale what a human otherwise does by hand:
- Anomaly detection — learn what “normal” looks like and flag deviations, instead of you setting static thresholds.
- Event correlation & noise reduction — collapse a storm of 500 related alerts into one incident, so on-call isn’t drowned.
- Root-cause assistance — surface the likely trigger among thousands of signals.
- Prediction & automation — forecast capacity or failures, and (at higher maturity) recommend or trigger a remediation.
AIOps is more automation-oriented. Depending on its maturity it can be diagnostic, predictive, or prescriptive — from flagging anomalies to recommending or triggering action. But it needs operational data to reason about — much of which comes from the same telemetry pipeline your observability platform uses, augmented with events, incidents, changes, and topology.
Side by side
| Observability | AIOps | |
|---|---|---|
| Question it answers | What’s happening, and why? | What matters, and what to do about it? |
| How it’s used | Engineers investigating and exploring | Models scoring, correlating, and automating |
| Input | Telemetry — metrics, logs, traces, profiles | Overlapping data — telemetry plus events, incidents, changes, topology |
| Output | Dashboards, query results, trace views | Anomalies, correlated incidents, root-cause hints, automation |
| Failure mode | Too much data, not enough time | Bad models, false positives, “black box” distrust |
| Maturity | Well-established, open standards (OpenTelemetry) | Newer, mostly proprietary, quality varies a lot |
The table makes the relationship clear: observability platforms and AIOps systems consume overlapping operational data, but use it differently. Observability helps engineers investigate and understand systems; AIOps uses AI to prioritise, correlate, predict, and automate operational work. They’re not competitors on the same rung — they’re two consumers of the same foundation.
The real relationship: a shared foundation, two consumers
Think of it as layers, not alternatives. Applications and infrastructure emit telemetry, events, and operational context. A telemetry pipeline collects, cleans, enriches, and routes it. On top of that data sit both your observability platform (where humans explore) and your AIOps system (where models score) — with AIOps typically pulling in extra sources like incidents, changes, and topology as well. Same foundation, different consumers.
This is why “observability vs AIOps” is the wrong framing. You run observability to make systems understandable, and you add AIOps when signal volume outgrows what humans can triage by hand. Both draw on the same governed telemetry — which is why the pipeline underneath matters more than the “versus.”
Which teams work on which layer?
The difference gets clearer when you look at who uses each layer. Boundaries vary by organisation, but the operating model usually looks like this:
| Team | Primary layer | What they do |
|---|---|---|
| Application & product teams | Observability platform | Instrument services, build dashboards, inspect logs and traces, troubleshoot releases. |
| SRE & production engineering | Observability + AIOps | Define SLOs, investigate incidents, analyse dependencies, reduce alert noise, automate recurring responses. |
| Observability / platform engineering | Telemetry pipeline + observability | Operate the Collectors, manage schemas and attributes, control routing and sampling, provide shared tooling. |
| IT operations & NOC | AIOps + event management | Monitor infra and services, consume correlated events, prioritise incidents, trigger operational workflows. |
| IT service management | AIOps + ITSM | Connect incidents with services, changes, configuration items, ownership, and escalation. |
| Security, privacy & compliance | Telemetry governance | Define what may be collected, where it may be sent, which fields must be masked, and how access and retention are controlled. |
Application teams spend most of their time in observability tools, exploring the systems they build. Operations teams live more in AIOps, event-management, and ITSM platforms, where signals from many technologies get consolidated into incidents and actions. Platform and observability teams sit between: they operate the shared telemetry foundation — collecting, standardising, de-noising, masking, and routing signals to the right destinations.
These roles aren’t exclusive. SRE, platform engineering, and incident-response teams frequently work across observability, AIOps, ITSM, and telemetry-management systems. The point isn’t rigid lanes; it’s that buying an AIOps platform doesn’t remove the need for engineering observability, and an observability platform doesn’t hand a NOC the operational workflows it needs. Each layer serves different users on shared, consistently governed data.
A control plane like LinkMesh is operated primarily by the observability or platform-engineering team. Application teams shouldn’t have to manage individual Collector configs; the platform team provides reusable policies and pipelines for collection, enrichment, PII masking, sampling, and routing, while application, SRE, operations, and security teams define the requirements those pipelines must satisfy.
Garbage in, garbage out — the pipeline decides both
Here’s the part most “AIOps will fix everything” pitches skip: an ML model is only as good as the data it’s fed. Point AIOps at noisy, inconsistent, half-labelled telemetry and you get confident nonsense — false positives that erode trust faster than no AIOps at all. The layer that determines quality for both consumers is the pipeline underneath:
- Clean, consistent structure. Standardised resource attributes such as
service.name,service.namespace, anddeployment.environment.name— plus an organisation-wide convention for things like service ownership — let a model and a human group and correlate signals reliably. Inconsistent tagging breaks correlation for everyone. - Noise reduced at the source. Dropping health-check spam and sampling repetitive events means AIOps learns from signal, not chatter — and your bill tracks value, not volume. It’s the same cost-reduction work that makes observability affordable.
- Sensitive data masked before egress. Feeding an AIOps/ML service raw logs full of usernames, emails, and tokens is a real risk. Masking sensitive fields before telemetry leaves the controlled environment reduces downstream exposure and can simplify compliance assessments — though it does not by itself put an AIOps or AI service out of regulatory or privacy scope. See PII masking in logs.
- Routed to many, without an agent per backend. Because the pipeline is built on OpenTelemetry and OTLP, the same clean telemetry can be exported to your observability backend and an AIOps engine without deploying a separate host agent for each — destination-specific exporters or gateways may still be needed, but you avoid vendor lock-in on either side.
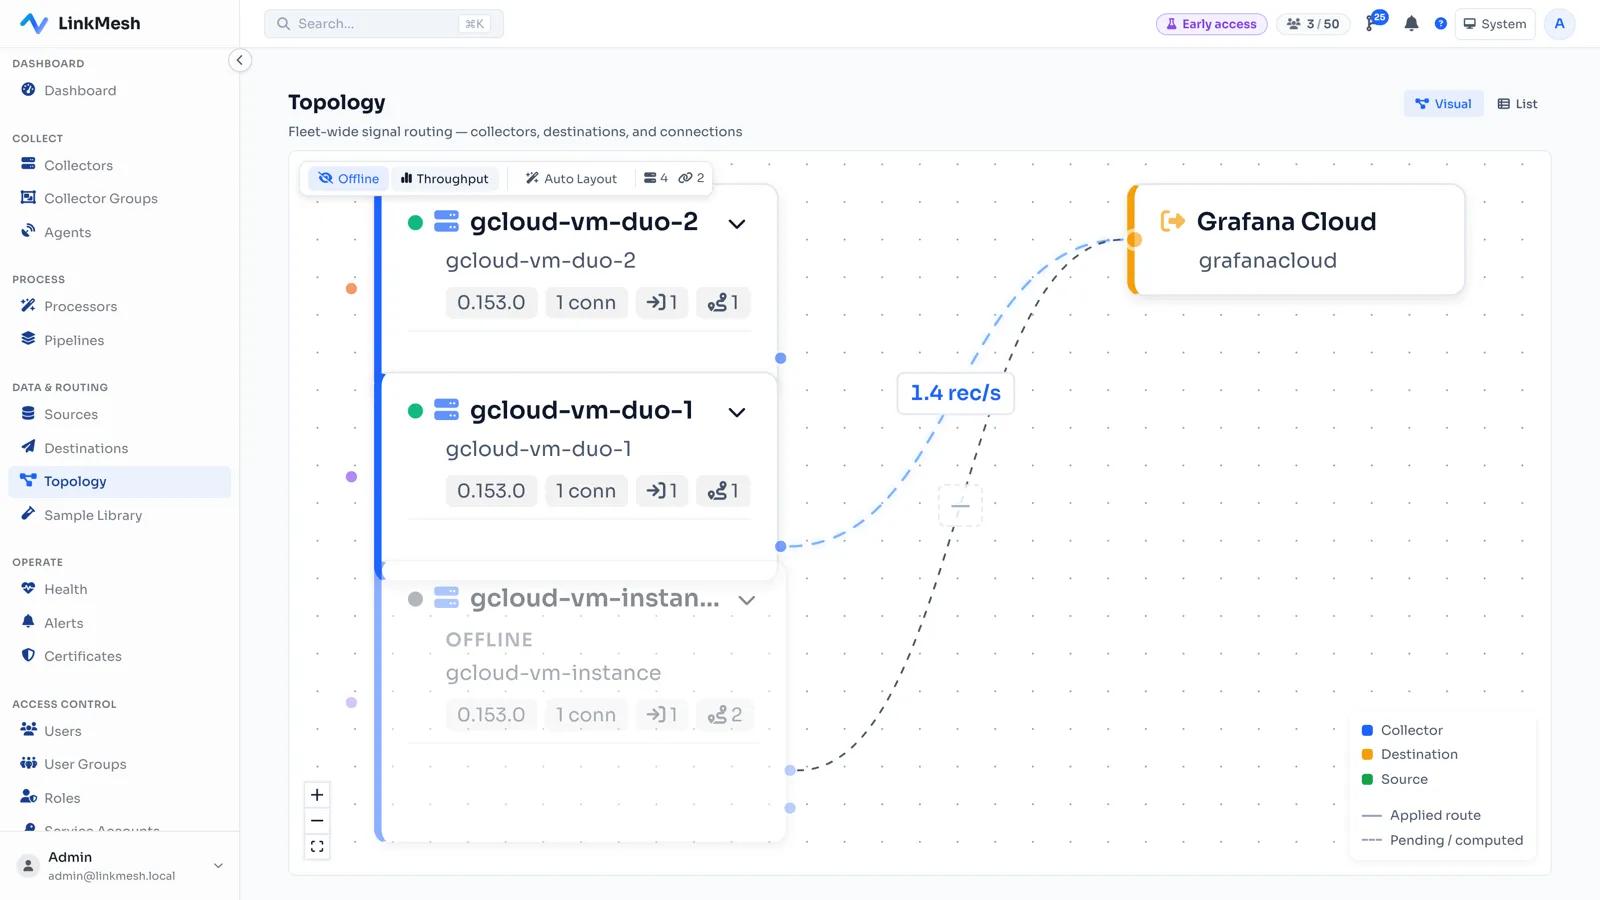
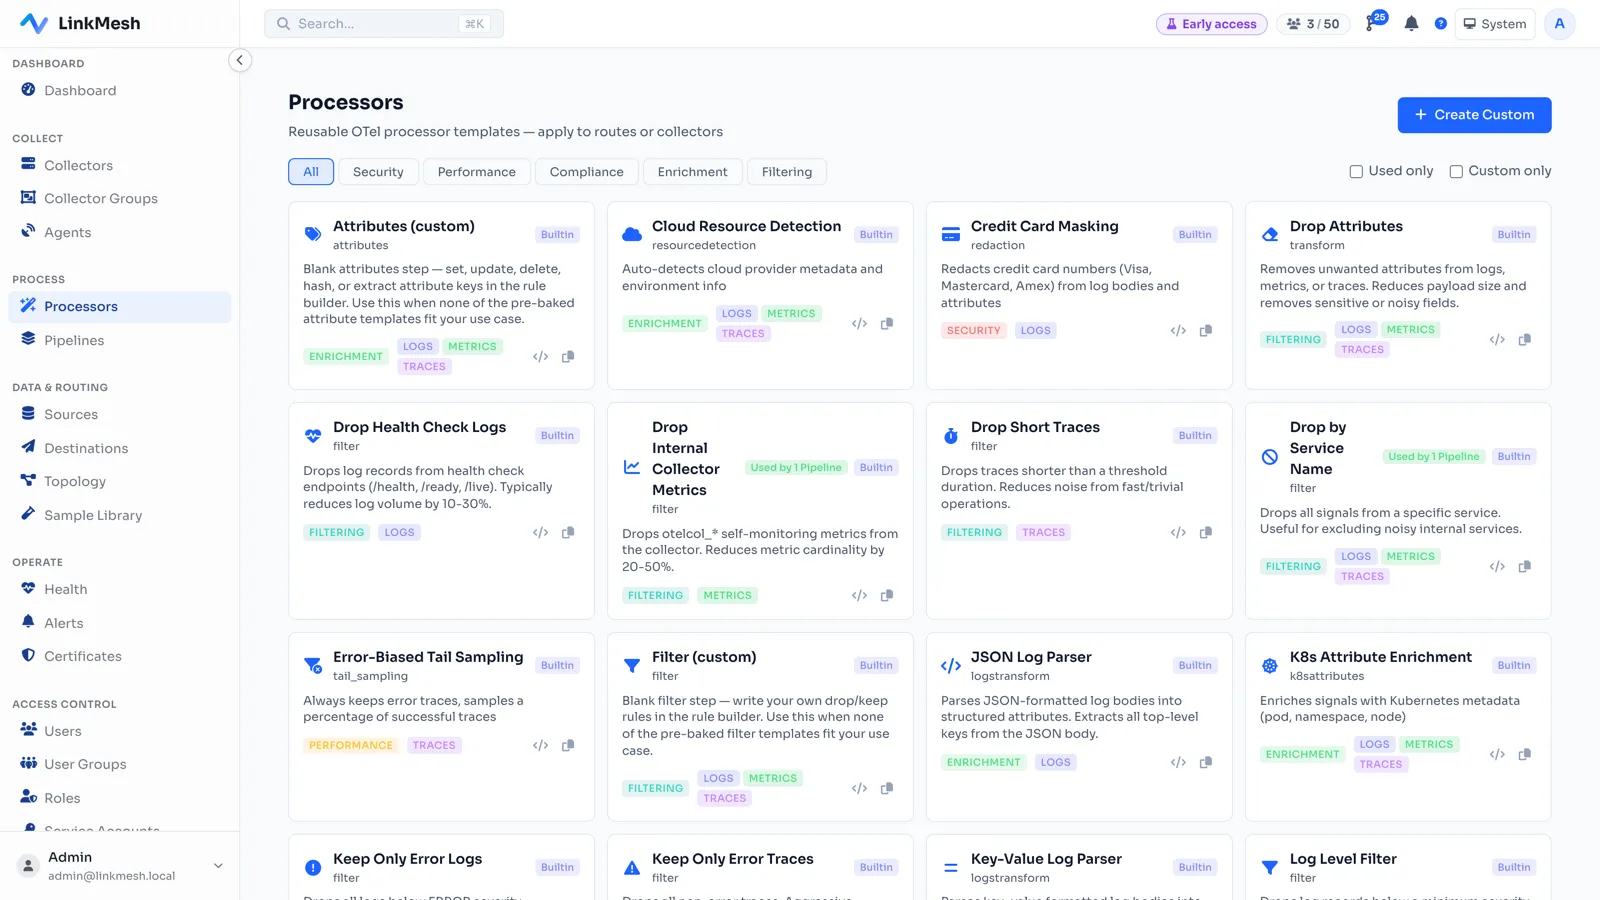
This is exactly where a control plane like LinkMesh sits: it manages the OpenTelemetry Collectors that collect, enrich, mask, and route your telemetry — the foundation that makes your observability usable and your AIOps trustworthy. Get that layer right and both consumers improve; get it wrong and no amount of ML rescues the data.
Align it to the business, not just the infrastructure
A telemetry foundation also needs business alignment — otherwise you build a technically impressive data platform that collects enormous volumes without clearly improving customer outcomes. Alignment doesn’t mean business teams configure collectors or alert rules; it means the platform’s priorities derive from business-critical services and risks:
- Critical services — which customer journeys, products, and processes matter most?
- Service objectives — what availability, performance, and recovery targets apply?
- Business impact — which failures hit revenue, customers, regulation, or reputation?
- Cost governance — is the value of the telemetry proportional to storing and processing it?
- Compliance — which telemetry may be collected, retained, or sent to external platforms?
| Level | Defines |
|---|---|
| Business & service owners | Critical services, impact, priorities, risk tolerance |
| Product & application teams | Service indicators, instrumentation, application dashboards |
| SRE & operations | SLOs, alerts, incident response, reliability improvements |
| Observability platform team | Shared collection, governance, pipelines, tooling, enablement |
| Security & compliance | Data classification, masking, access, retention |
The platform team shouldn’t decide alone what’s important; it provides the technical capabilities while business and service owners define why a service matters and how reliable it must be. The principle: business priorities define what must be reliable; observability provides the evidence to operate and improve it. Without that alignment, teams measure infrastructure health while missing the actual service — every server green while customers can’t complete a payment or log in.
Where to start
- Get observability solid first. Standardise on OpenTelemetry, collect metrics, logs, and traces with consistent attributes, and give humans good dashboards. This is the foundation, and it delivers value on day one.
- Fix the pipeline, not just the backend. Reduce noise, mask sensitive fields, and standardise tags at the collection layer — it’s what makes the data affordable and AIOps-ready.
- Add AIOps when volume demands it. When alert fatigue and signal overload outpace human triage, layer ML on top of the governed data you already have. Start narrow (anomaly detection or alert correlation) and expand as it earns trust.
Observability vs AIOps was never a real contest. Observability makes systems understandable; AIOps helps operations scale. Both stand on the same governed telemetry — so the smartest early investment is the pipeline that keeps that telemetry clean, compliant, and vendor-neutral underneath them.
LinkMesh is a self-hosted control plane for OpenTelemetry Collectors — collect, enrich, mask, and route governed telemetry to any backend or AIOps engine, priced per collector rather than per gigabyte. Stand one up in minutes, or see what it does.