

 LinkMeshObservability Data Collection Management
The End of Vendor Lock-In
OpenTelemetry makes your telemetry portable — and your backend a choice.
 Philippe Braxmeier← Back to blog
For fifteen years, observability worked like this: you picked a vendor, installed their agent on every host, instrumented your code with their SDK, and shipped everything to their backend. It worked — right up until the renewal quote landed, or the bill outgrew the value, or a better tool appeared that you couldn’t move to without re-instrumenting your entire estate.
That last part is the trap. The switching cost wasn’t the data; it was the agent and the SDK. Every proprietary agent you deploy and every proprietary API you call is a thread stitching you to one vendor. Enough threads and moving becomes a multi-quarter project nobody wants to sponsor — which is exactly why the pricing holds.
OpenTelemetry (OTel) breaks the trap. Not by being a cheaper backend — it isn’t a backend at all — but by turning the parts that used to lock you in into open standards you own. This post is about why OTel loosens vendor lock-in, what the moving pieces are, and how to actually get from a proprietary stack to a portable one.
OpenTelemetry does not eliminate every form of vendor dependency. It gives you control over the collection and routing layer — the agents and the wire format — which is what makes backend changes substantially easier. It does not by itself replace dashboards, alert logic, proprietary analytics, or the backend’s storage and query language; those still have to be rebuilt or retained. The win isn’t “no lock-in ever” — it’s a credible technical exit path where today you have none. This guide is about earning that exit path honestly.
What “lock-in” actually is
Lock-in isn’t one thing; it’s three layers, and a proprietary vendor owns all three:
- Instrumentation — the SDK in your application code that produces spans, metrics, and logs. Rip-and-replace means editing every service.
- Collection — the agent on every host or pod that scrapes, batches, and forwards telemetry. Rip-and-replace means a fleet-wide redeploy.
- The wire format — the proprietary protocol the agent speaks to the backend. As long as your data only comes out in one vendor’s shape, only one vendor can read it.
When all three are proprietary and welded together, you don’t have a data pipeline — you have a one-way pipe into a single destination. OpenTelemetry replaces each layer with an open equivalent, and the moment it does, the destination becomes a swappable choice instead of a life sentence.
The three standards that end lock-in
OpenTelemetry is a CNCF project — the second most active after Kubernetes — and it gives you an open replacement for each of those three layers.
OTLP — the wire format. The OpenTelemetry Protocol is a single, vendor-neutral format for logs, metrics, and traces. When your telemetry is OTLP, any backend that speaks OTLP can receive it, and most now do. Your data stops being a vendor’s dialect and becomes a lingua franca.
The OTel Collector — collection. The Collector is an open-source agent that receives telemetry from anything (OTLP, syslog, Prometheus, filelog, Kafka, host metrics), processes it, and exports it to anything. It sits between your sources and your backends as a neutral broker. Change backends and you change one exporter block — not one agent on every host.
OpAMP — fleet management. The Open Agent Management Protocol is the newest piece: a standard for remotely configuring and managing a fleet of collectors from a central control plane. It’s what turns “a collector on every host” from an unmanageable sprawl of YAML files into a fleet you steer from one place. (We wrote a full explainer in OpAMP, explained.)
Together these mean the expensive, sticky parts of your observability stack — instrumentation and collection — are things you own and can point anywhere. The backend becomes the only thing you’re buying, and buying a backend you can leave is a very different negotiation from buying one you can’t.
Once collection is neutral, routing is free
Here’s the part that turns lock-in on its head. When every source speaks OTLP into a neutral collector, the collector can send that same stream to more than one destination — and send different slices to different places.
That unlocks the moves proprietary agents can’t make:
- Dual-run a migration. Ship to your incumbent and a candidate backend at the same time, compare them on real production data, and cut over only when you’re satisfied. No flag day, no leap of faith.
- Route by value. Send the 10% you actively query to a premium backend and the long tail to cheap object storage — the core move in reducing observability costs.
- Avoid re-lock-in. Because the pipeline is neutral, switching again later is another exporter change, not another migration. You don’t trade one cage for a nicer cage; you get rid of the cage.
This is what a neutral pipeline looks like in practice — one stream in, several interchangeable backends out, each getting only what it should:
What OpenTelemetry replaces — and what it doesn’t
This is the part most “ditch your vendor” posts skip, and it’s the part that decides whether your migration succeeds. OpenTelemetry is a standard for producing, collecting, and shipping telemetry. It is not an observability backend — it doesn’t store, index, visualize, or alert. So a realistic migration replaces the collection layer and keeps or rebuilds everything downstream:
| Capability | Move to OTel? | What it actually means |
|---|---|---|
| Host & infrastructure metrics | Usually | hostmetrics receiver covers the standard set; validate any vendor-specific metrics you rely on. |
| Application traces | Usually | OTel SDKs / auto-instrumentation emit OTLP; instrumentation coverage may differ from a proprietary agent. |
| Log collection & forwarding | Often | filelog / journald receivers collect; parsing and routing rules must be recreated as processors. |
| PII redaction / data shaping | Yes | transform / redaction / filter processors — often better than a closed agent, and before egress. |
| Dashboards | No | Not an OTel concern — rebuild in the new backend or keep the old one. |
| Alerting logic | No | Alert rules live in the backend; they migrate separately. |
| RUM / session replay | Usually not | Vendor-specific capability; OTel has browser/mobile signals but not feature parity. |
| Continuous profiling | Emerging | OTel profiling is young; treat vendor profilers as not-yet-replaced. |
| Service topology / maps | Partial | Derivable from OTLP traces, but proprietary topology (e.g. auto-discovered maps) may not transfer 1:1. |
| Backend storage & query language | No | OTel is not a backend. This is where residual lock-in lives — and where routing gives you leverage. |
The pattern is clear: OTel decouples the left side of the pipeline (produce, collect, route) and leaves the right side (store, query, visualize, alert) to whatever backend you point it at. That’s exactly the layer where lock-in was most expensive — the agents and the wire format — so decoupling it is what turns a backend from a life sentence into a line item. The residual lock-in that remains (dashboards, queries, analytics) is real, but it’s portable effort, not a technical wall.
The honest catch: OTel gives you the standard, not the fleet
There’s a gap that trips up teams who expect OpenTelemetry to be turnkey. OTel gives you the protocol, the collector, and the management standard. It does not give you the thing that makes a large fleet livable: a control plane that renders validated config, pushes it to the right nodes, previews a change before it ships, and shows you throughput on every edge.
Out of the box, a fleet of OTel Collectors is a set of YAML files you keep in sync by hand — which is a real operational burden, and the reason some teams stay on a proprietary agent that at least ships with a management UI. The answer isn’t to give up the open standard; it’s to put an open-standard control plane on top of it.
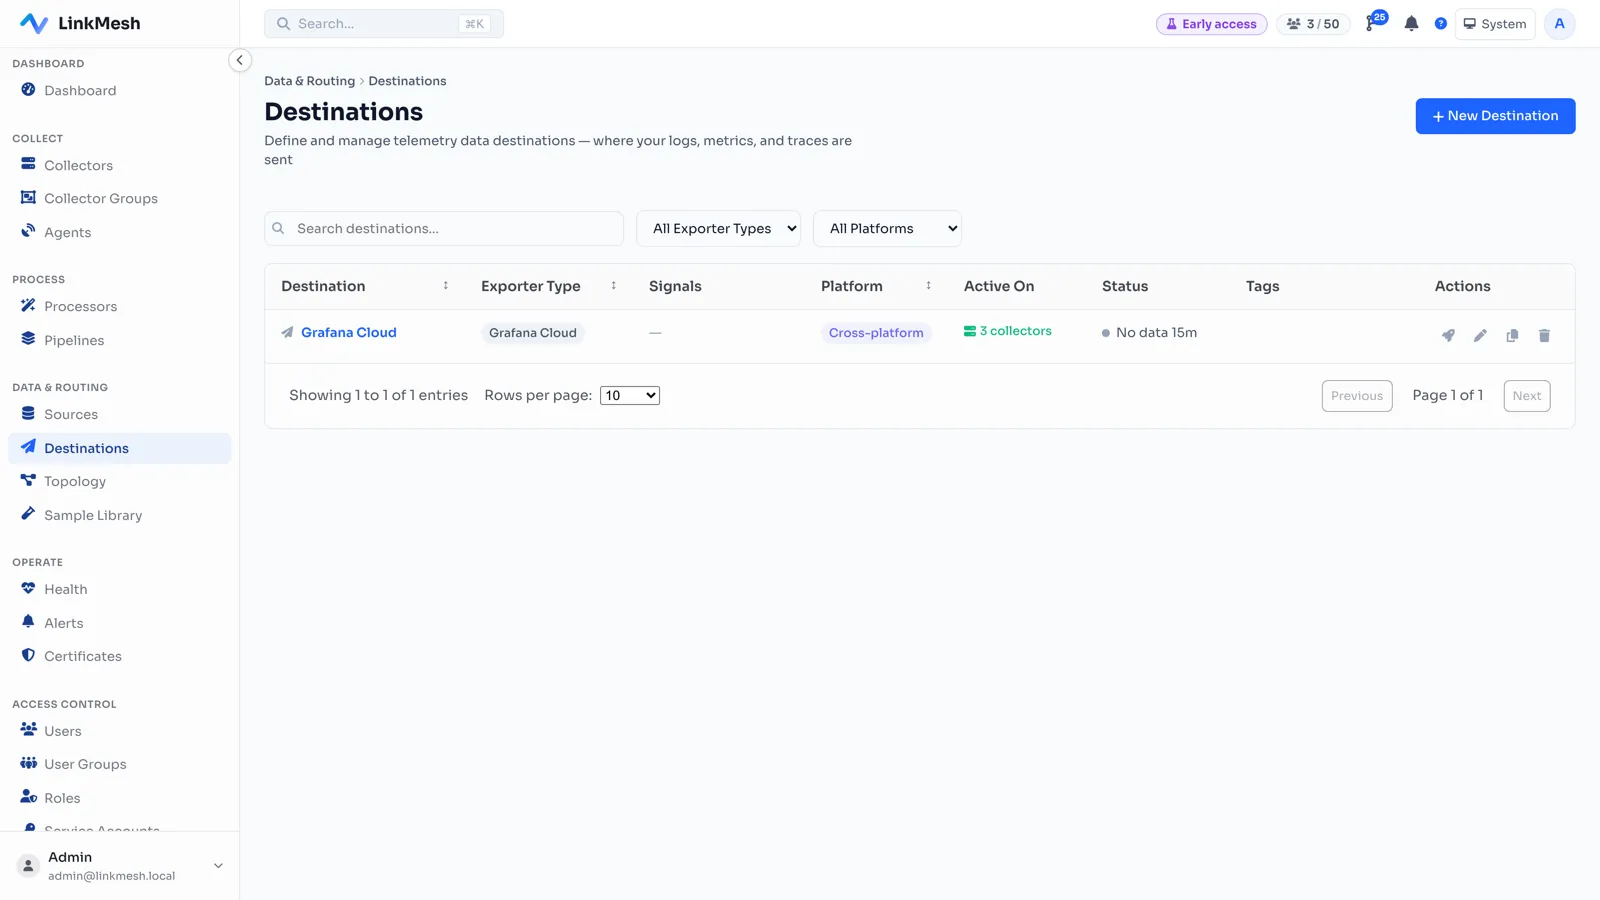
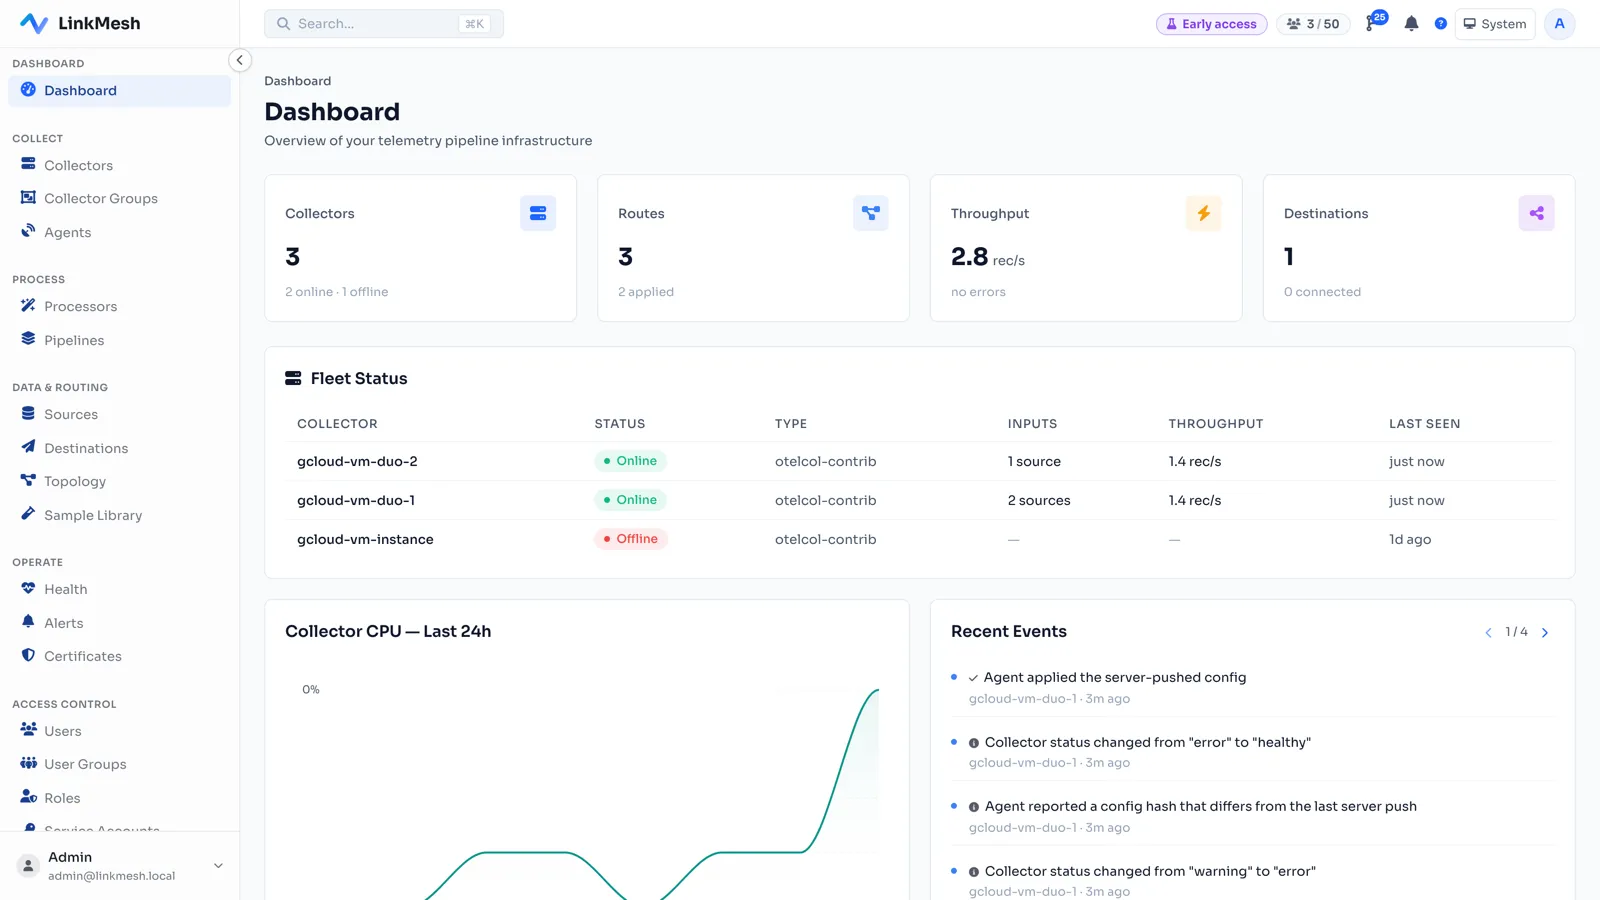
That’s exactly where LinkMesh fits. It’s a self-hosted control plane for OpenTelemetry Collectors: point your collectors — otelcol-contrib running under the OpAMP Supervisor, or Grafana Alloy over remotecfg — at LinkMesh with one config block and a token, then compose sources, processors, routes, and destinations in a visual builder. LinkMesh renders and validates the collector config and delivers it to the right nodes; the telemetry itself never flows through LinkMesh — it stays on your infrastructure. And because it’s priced per managed collector, not per gigabyte, the tool that frees you from volume-based backend pricing isn’t itself metered by volume.
Where to start: pick a vendor and dual-run
The migration is less scary than it looks, because OTel lets you move without a big bang. The pattern is the same regardless of which vendor you’re leaving:
- Deploy OTel Collectors alongside your existing agents — don’t remove anything yet.
- Dual-ship: keep exporting to your incumbent backend, and add an exporter to a candidate. Compare dashboards and alerts on live data.
- Refine in the pipeline: filter noise, sample high-volume streams, and mask PII before egress — savings you couldn’t get from inside a closed agent.
- Cut over the incumbent exporter when parity holds, and decommission the old agents.
Before you start, read what OpenTelemetry can and cannot replace so you scope the migration to the collection layer and plan the dashboard/alert rebuild deliberately rather than discovering it mid-cutover. Then pick your vendor playbook:
- Migrate Splunk Enterprise to OpenTelemetry — replacing universal forwarders and the HTTP Event Collector.
- Migrate from Dynatrace to OpenTelemetry — decoupling from the OneAgent and escaping host-unit / DDU pricing.
- Migrate from Datadog to OpenTelemetry — replacing the Datadog Agent and the per-host + per-GB bill.
- Migrate from New Relic to OpenTelemetry — replacing the New Relic agents and moving off consumption pricing.
- Migrate from Elastic Agent to OpenTelemetry — replacing Beats and Elastic Agent while keeping (or leaving) the Elastic Stack.
Vendor lock-in in observability was never a technical necessity — it was a business model that depended on your instrumentation being un-portable. OpenTelemetry makes it portable. Once your data speaks OTLP and your collectors are managed on open standards, your backend is a decision you get to revisit whenever you like — which is the whole point. It won’t rebuild your dashboards for you, but it hands you the one thing you never had before: leverage.
The exit path is only real if the fleet is manageable. LinkMesh is a self-hosted control plane to version, validate, deploy, and audit OpenTelemetry Collector configuration — priced per collector, not per gigabyte. Stand up a control plane and enroll your first collector in minutes, or see what it does and the pricing model.