LinkMesh

Search docs, blog and changelog

ENDE

Splunk telemetry pipeline

Build a vendor-neutral telemetry pipeline in front of Splunk

Put an OpenTelemetry collection layer between your sources and Splunk: standardize collection, fan out to more than one backend, dual-ship a migration safely, and manage the whole pipeline centrally. Splunk stays your backend — it just stops being the only thing your architecture is wired to.

Start free →

25 Collectors free after a no-card registration · 5 without one How the free tier works

Trying to cut the bill rather than restructure the pipeline? Reduce Splunk ingest cost →

A forwarder wired to Splunk isn’t a pipeline

Sending straight to Splunk works until you need a second backend, a safe migration, or a collection tier anyone can actually manage. These are the limits you hit.

Collectors wired straight to Splunk

Point the Universal Forwarder or a HEC token at Splunk and every source is hard-coupled to one backend. Changing anything means touching every host.

No second backend

When a team wants metrics in Prometheus or traces in Tempo, there is no layer to fan telemetry out — so you stand up a parallel pipeline instead.

Migration means rip-and-replace

Evaluating an alternative to Splunk means re-instrumenting or re-pointing agents, with no safe way to send to both and compare.

No buffer, no backpressure

A direct forwarder path has nowhere to absorb a backend outage or a spike; when Splunk is slow, the pressure lands back on your hosts.

Every source speaks a dialect

Syslog here, a forwarder there, an SDK somewhere else. Without a common collection layer, each source is its own onboarding and its own drift.

A pipeline nobody manages

The collection tier grows host by host with no inventory, no version control, and no one able to say what the pipeline actually is.

OpenTelemetry as the layer in front of Splunk

Sources feed a managed OpenTelemetry Collector; the collector ships to Splunk over the splunk_hec exporter and, on the same routes, to any other backend. LinkMesh manages the collectors; your telemetry never passes through LinkMesh.

CONTROL PLANE · config, health (never telemetry)LinkMesh — self-hosted control planemanages the pipeline on every collectorconfig · healthSourcesapps · hostssyslog · K8sCollector Fleetreceive · buffer · routeotelcol-contrib · Grafana Alloymanaged by LinkMeshSplunksplunk_hec exporterOther backendsGrafana · S3 · any OTLPtelemetryHECOTLP
Standard collectors receive, buffer, and route — to Splunk over splunk_hec and to any other backend on the same routes.

01

One OpenTelemetry collection layer

Problem

Every source coupled directly to Splunk is a pipeline you can only change one host at a time — and can only ever point at Splunk.

LinkMesh

Put a standard OpenTelemetry Collector (or Grafana Alloy) in front of Splunk as the collection layer. Sources speak OTLP or their native protocol to the collector; the collector ships to Splunk with the splunk_hec exporter. LinkMesh manages that collector across the fleet.

A single, standard collection tier — not a forwarder wired to one backend.

How pipelines compose in LinkMesh →
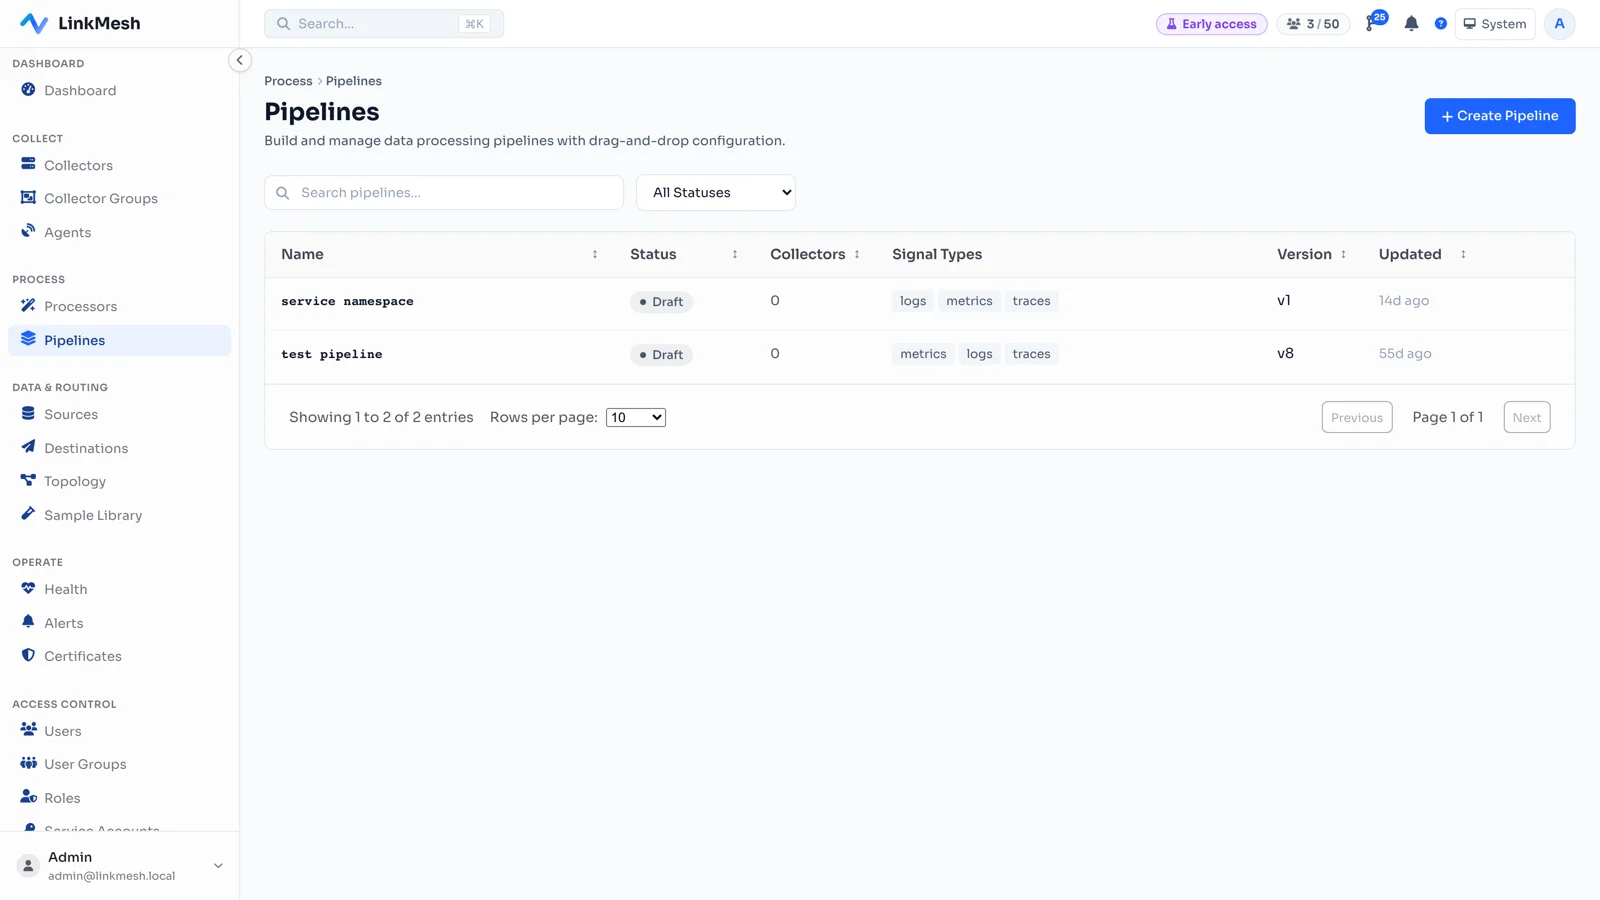
The LinkMesh pipelines view — sources, processors, and destinations composed into a named pipeline.
A pipeline is sources → processing → destinations, managed centrally rather than per host.

02

Send to Splunk and somewhere else

Problem

Security wants logs in Splunk; SRE wants metrics in Prometheus; someone wants an archive in object storage. One forwarder can’t do that.

LinkMesh

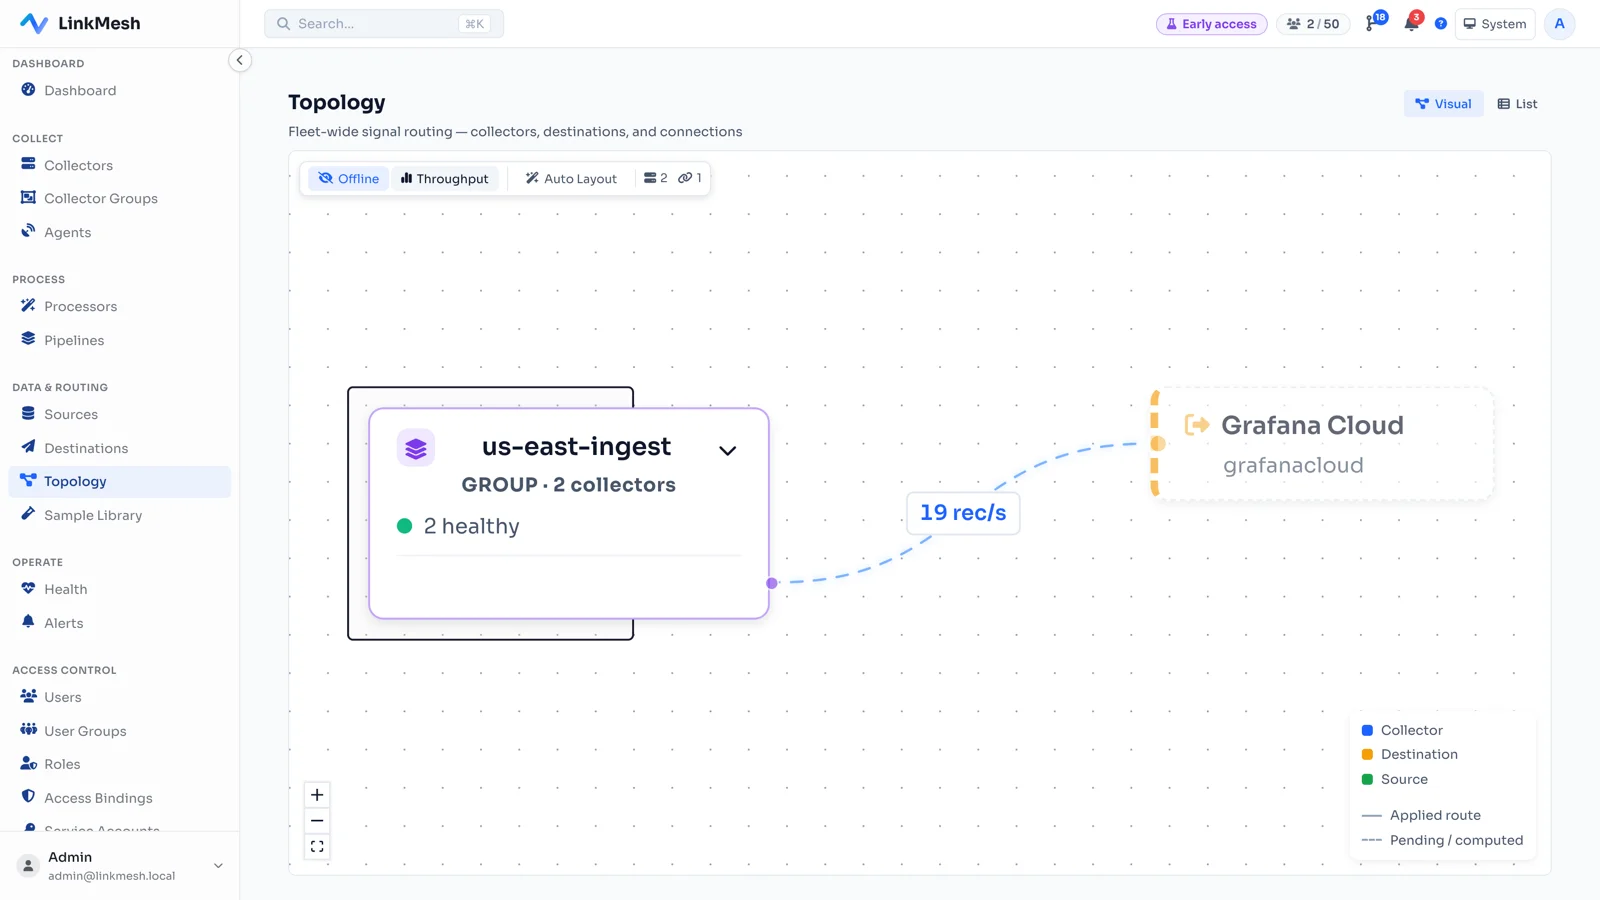
Define routes on the collector: the same source fans out to Splunk (splunk_hec) and to any other OTLP backend, each with its own processing chain. The topology view shows live throughput on every edge.

Splunk stays for what belongs there; everything else has its own destination.

How routes fan telemetry to backends →
The LinkMesh topology view — a collector group routing telemetry to multiple destinations with live records-per-second on each edge.
One collector, multiple destinations — Splunk plus any other backend, side by side.

03

Dual-ship during a migration

Problem

Evaluating a Splunk alternative usually means a risky cut-over: re-point agents and hope, with no way to compare the two backends on the same data.

LinkMesh

Route the same telemetry to Splunk and a candidate backend at once, so you compare them on identical data before committing — and cut over route by route, not all at once. Dual-shipping is configured so the second destination doesn’t duplicate or double-count.

A reversible, side-by-side migration path instead of a leap.

How-to: add a second destination →

04

Buffering and backpressure

Problem

A forwarder pointed straight at Splunk has nowhere to absorb an outage or a spike; when the backend is slow, the pressure lands on your hosts.

LinkMesh

The collector tier gives you a place for queuing, retry, and backpressure between your sources and Splunk, so a backend hiccup is absorbed at the collector instead of stalling the source.

A backend blip stops at the collector — not at the application.

How a collector is modelled in LinkMesh →

05

Keep Splunk without coupling to it

Problem

Wiring every source directly to Splunk makes Splunk load-bearing in your architecture — and any future change a fleet-wide rewrite.

LinkMesh

With a vendor-neutral OpenTelemetry layer in front, Splunk is one destination behind a standard interface. Add, remove, or swap a backend by changing a route — the collectors and instrumentation don’t move.

Keep Splunk today; keep your options open for tomorrow.

How managed config is delivered →

06

A pipeline you actually manage

Problem

A collection tier that grows host by host has no inventory and no version control — nobody can say what the pipeline is, or roll a change back.

LinkMesh

LinkMesh manages the collectors that make up the pipeline: central config, staged rollout, drift detection, and Git-versioned changes with one-click rollback — over OpAMP (otelcol-contrib) and remotecfg (Grafana Alloy).

The Splunk pipeline becomes a managed, versioned system instead of tribal knowledge.

How-to: enroll a collector →

What LinkMesh is — and what it isn’t

What it is

The control plane for the OpenTelemetry collection layer in front of Splunk — it configures, versions, rolls out, and monitors the collectors that receive, buffer, and route your telemetry.

What it isn’t

It is not a telemetry backend and it does not replace Splunk. LinkMesh does not ingest, index, or store your data — the collectors ship it straight to Splunk and your other backends, and it never transits LinkMesh.

If nothing changes

Left alone, none of this gets cheaper: the volume grows on its own, the data that already left cannot be recalled, and each agent added is one more to remove later.

Once it is running

  • A per-collector bill that a volume spike does not move.
  • Sensitive fields masked on the host, before anything leaves the network.
  • Every config change a diff you can review and roll back.
  • Backends you can swap, because nothing proprietary sits in the path.

Common questions

How does OpenTelemetry send data to Splunk?

Through the OpenTelemetry Collector’s splunk_hec exporter, which sends to Splunk’s HTTP Event Collector. Sources feed the collector; the collector ships to Splunk and, if you want, to other backends at the same time. LinkMesh manages that collector across your fleet.

Can I keep Splunk and still use OpenTelemetry?

Yes. OpenTelemetry becomes the vendor-neutral collection layer in front of Splunk. Splunk stays your backend; the collector standardizes collection and lets you route to other destinations without re-instrumenting.

Can I send telemetry to Splunk and another backend at once?

Yes. Define routes so the same source fans out to Splunk and to any other OTLP backend, each with its own processing. This is also how you dual-ship during a migration — compare two backends on identical data and cut over route by route.

Does my telemetry pass through LinkMesh?

No. LinkMesh is a self-hosted control plane and carries only configuration and health. Your collectors send telemetry directly to Splunk and your other backends — it never transits LinkMesh.

Is this the same as reducing Splunk ingest cost?

Related but distinct. This page is about the pipeline architecture — a vendor-neutral collection layer, multi-backend routing, and migration. Reducing what you pay Splunk to ingest (filtering, dropping, sampling at the source) is covered on the reduce-Splunk-ingest-cost page.

How is LinkMesh priced?

By managed collector, never by data volume. The first 25 collectors are free after a no-card registration in the OpenSight Customer Portal (5 without one); beyond that it is a flat USD 12.50 · CHF 12.00 · EUR 12.50 per collector per month, billed annually, and the bill stops growing at 200 collectors.

Put a standard pipeline in front of Splunk

Self-hosted, vendor-neutral, priced per collector. Stand LinkMesh up, enroll your collectors, and route to Splunk and beyond from one control plane. The first 25 Collectors are free after a no-card registration in the OpenSight Customer Portal (5 without one).

Install the control plane on any Linux VM — Ubuntu / Debian

curl -fsSL https://artifacts.saas.opensight.ch/binaries/linkmesh-server/latest/linkmesh-server_latest_amd64.deb -o linkmesh-server.deb && sudo apt install -y ./linkmesh-server.deb

RHEL / Rocky / AlmaLinux, collector enrollment, and the full walkthrough: Install guide →

Test this in your own environment

Use these maintained guides to move from product evaluation to a working configuration.

Check versions and limitations first