
 LinkMeshObservability Data Collection Management
Windows Server → Grafana
CPU, disks, PerfMon counters, and Event Logs — one Windows service. No Kubernetes required.
 Roman Hüsler← Back to blog
Windows Server already exposes everything you need through Performance Monitor and Event Viewer. The problem starts when you need to watch more than one server: retain the data, build dashboards, or search events across the whole estate. Task Manager only shows the current moment; PerfMon has every counter but no history; Event Viewer is painful to work across ten machines, let alone a hundred.
The OpenTelemetry Collector runs as a normal Windows service. It reads the same performance counters and event channels you already know, and sends them to Grafana. You install one MSI, paste in your Grafana connection details, start the service, and your server shows up in a central dashboard. No Kubernetes, no three separate agents.
Windows administrators running Windows Server (2016–2025) who live in Event Viewer,
Performance Monitor, and services.msc and want one central view in
Grafana — without a per-server agent licence. You need local admin on the box and a
Grafana target (Grafana Cloud’s free tier is fine).
What you’ll have when you’re done
- Every server’s CPU, memory, disk free space, and network in one Grafana dashboard, with history — not just the live view Task Manager gives you.
- Windows Event Logs (System, Application, Security) searchable across all servers in one place, instead of clicking through Event Viewer machine by machine.
- One Windows service doing all of it — replacing a metrics agent, a perfmon/WMI exporter, and a separate log shipper.
How it maps to tools you already use
Nothing here is a new concept — it’s the Windows tooling you know, pointed at Grafana:
| You know it as… | OpenTelemetry reads it via… | In the config it’s called |
|---|---|---|
| Task Manager (CPU, RAM, disk, network) | the host-metrics collector | hostmetrics |
| Performance Monitor counters | the perfmon reader | windowsperfcounters |
| Event Viewer (System / Application / Security) | the event-log reader | windowseventlog |
| Your monitoring tool / dashboard | the destination it sends to | exporters |
Step 1 — Install with the Windows MSI
- Download the OpenTelemetry Collector (contrib) MSI for Windows from the
official releases
— pick the
otelcol-contrib_*_windows_amd64.msi. (You want the contrib build; the Windows event-log and perfmon readers ship there.) - Run the installer: Next → Next → Install. It registers a Windows service for you.
- Open
services.mscand confirm a service named OpenTelemetry Collector is present and set to start automatically. - The configuration file lives at
C:\Program Files\OpenTelemetry Collector\config.yaml— that’s the one file you’ll edit in the next steps.
The same install can be scripted from an elevated PowerShell instead of clicking through the wizard:
New-Service -Name "otelcol" -DisplayName "OpenTelemetry Collector" `
  -BinaryPathName 'C:\otelcol\otelcol-contrib.exe --config C:\otelcol\config.yaml' `
  -StartupType Automatic
Start-Service otelcol
Step 2 — Get your Grafana connection details
If you use Grafana Cloud (free tier is enough to start): go to Connections → OTLP → “Send data”. Copy the two things it shows you:
- the OTLP endpoint (looks like
https://otlp-gateway-<zone>.grafana.net/otlp), and - the Authorization header (a
Basic ...token built from your instance ID and an API key — Grafana generates it for you).
Keep them handy for the next step. (Self-hosting Grafana instead? You’ll point metrics at Prometheus/Mimir and logs at Loki — noted at the end of Step 3.)
Step 3 — Enable CPU, memory, disks, and Event Logs
You do not need to write this configuration from scratch. Download the ready-made
file, drop in your two Grafana values, and save it over
C:\Program Files\OpenTelemetry Collector\config.yaml:
⬇ Download the ready-to-use Windows Server config (config.yaml)
Here’s what it contains, in plain terms — each block maps to something you already recognise:
receivers:
  hostmetrics:            # Task Manager-style values: CPU, memory, disks, network
    collection_interval: 30s
    scrapers: { cpu: , memory: , network: , paging: , processes: , filesystem: }

  windowsperfcounters:    # values from Performance Monitor
    collection_interval: 30s
    perfcounters:
      - object: Processor
        instances: ["_Total"]
        counters: [{ name: "% Processor Time" }]
      - object: LogicalDisk
        instances: ["*"]
        counters: [{ name: "% Free Space" }]

  windowseventlog/system:      # entries from Event Viewer
    channel: System
  windowseventlog/security:
    channel: Security

exporters:
  otlphttp/grafana:            # where Windows sends the data — paste your values here
    endpoint: "https://otlp-gateway-<zone>.grafana.net/otlp"
    headers:
      Authorization: "Basic <base64 of instanceID:token>"

service:
  pipelines:                   # which data is switched on
    metrics: { receivers: [hostmetrics, windowsperfcounters], exporters: [otlphttp/grafana] }
logs: { receivers: [windowseventlog/system, windowseventlog/security], exporters: [otlphttp/grafana] }hostmetrics— the Task-Manager basics, with history.windowsperfcounters— any counter you’d add in Performance Monitor.windowseventlog— the Event Viewer channels you care about.exporters— the destination; this is where your Grafana values go.service— the on/off switch: only what’s listed here is actually collected.
Self-hosting Grafana? Replace the one exporter with two: prometheusremotewrite to
Prometheus/Mimir for the metrics, and otlphttp (or loki) to Loki for the Event
Log. Nothing else changes.
Step 4 — Restart and verify it works
- Open
services.msc, right-click OpenTelemetry Collector → Restart. - Confirm the service shows Running. (If it stops immediately, the config has a typo — see Troubleshooting.)
- Open Grafana → Explore, pick your metrics data source, and search for your server’s hostname. You should see CPU and memory within a minute or two.
- Switch the data source to Loki and query
{host_name="YOUR-SERVER"}— your Event Log entries are now searchable.
That’s the whole loop: one service, and the box is reporting to Grafana. Everything after this is making it nicer and adding more servers.
Step 5 — Import the Windows Server dashboard
Rather than build panels by hand, import the ready-made starter dashboard, then pick your server from the Server dropdown at the top:
⬇ Download the Windows Server dashboard (Grafana JSON)
In Grafana: Dashboards → New → Import → Upload JSON file, then choose your Prometheus and Loki data sources when prompted. It comes with panels for CPU busy %, memory used %, disk free % per volume, network throughput, a “server reporting” status tile, failed logins, reboots & shutdowns, service failures, and a searchable Event Log panel. Use it as-is or as a starting point. (The Event-Log panels match on event IDs and text, so on a non-English Windows or a different Loki label scheme you may need to tweak a query — the metric panels work as-is with the config above.)
Step 6 — Add roles: IIS, SQL Server, Active Directory
A file server, a SQL box, and a domain controller need different counters and event channels. Think of them as add-on packs on top of the basic config:
- Basic Windows Server — CPU, memory, disks, network, System + Application logs.
- IIS — the
Web ServiceandASP.NETperformance objects. - SQL Server — the
SQLServer:*objects (buffer, memory, SQL statistics). - Active Directory / Domain Controller —
DirectoryServicescounters plus theDirectory ServiceandDNS Serverevent channels. - File Server —
LogicalDiskand SMB counters, plus file-access auditing events.
You can hand-add these counters to every server’s config.yaml. Across a fleet,
that’s where it gets tedious — which is the next step.
Step 7 — Roll it out to many servers with LinkMesh
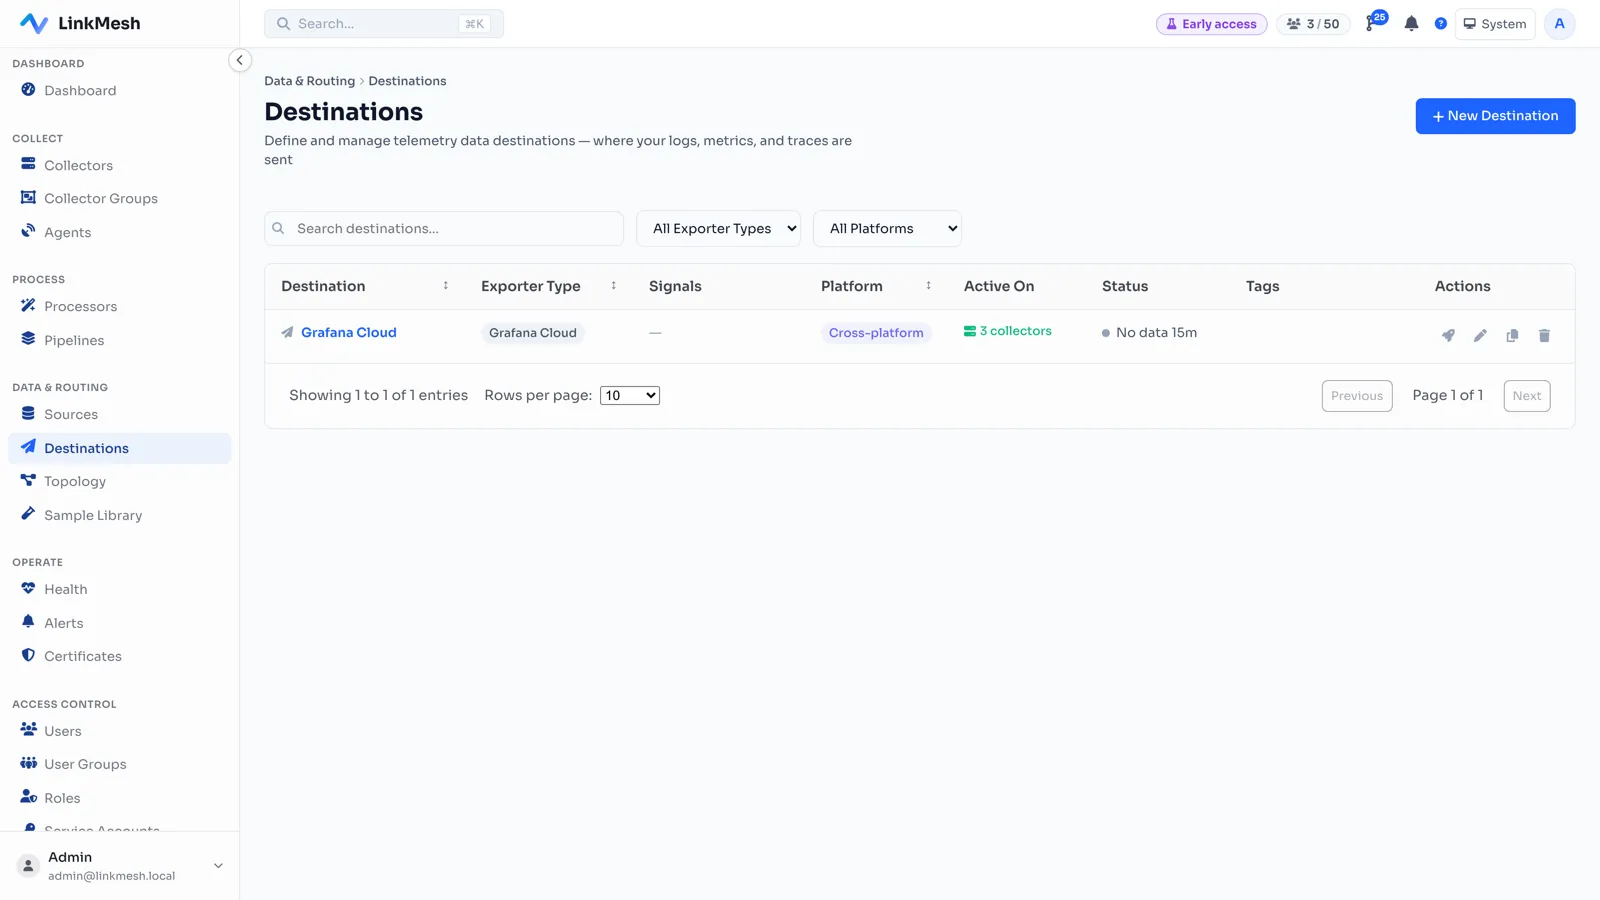
One server is a file you edit. A hundred servers — each a different role — is a fleet, and editing YAML over RDP on each one is exactly the toil that sends people back to the old agent.
The Collector on Windows speaks OpAMP, so it can be managed centrally instead. LinkMesh is a self-hosted control plane for exactly this: enroll each Windows Collector with a token, then pick the server role, preview the generated configuration, and deploy it — the basic pack here, IIS there, SQL somewhere else — without touching a single box over RDP. Every change is previewed, versioned, and audited.
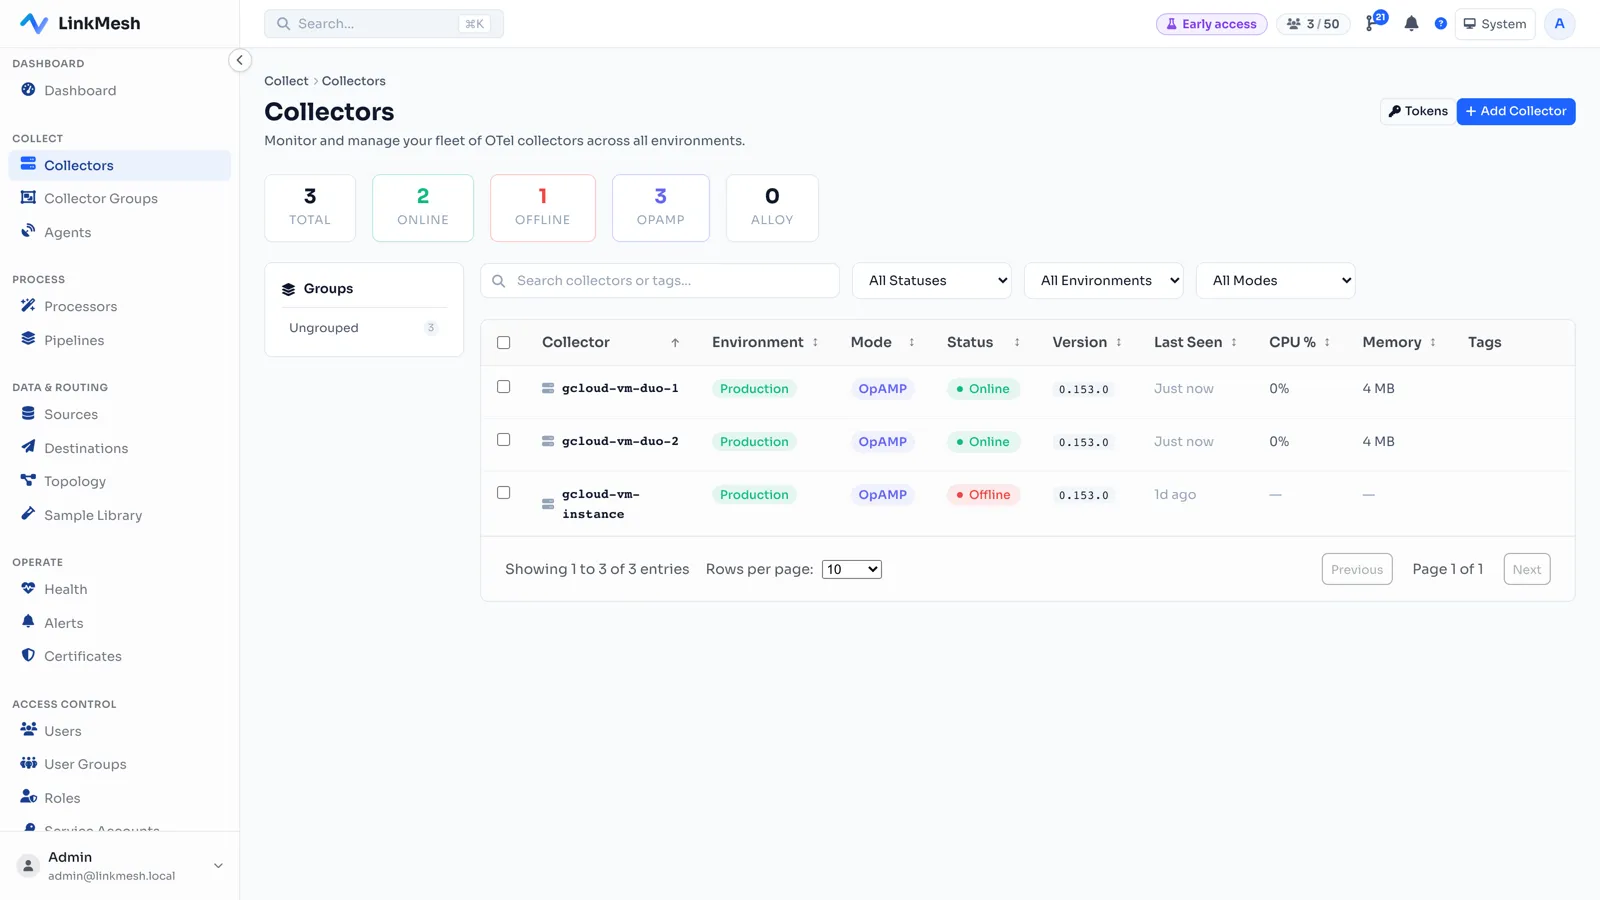
The telemetry still flows straight from each server to Grafana and stays on your network — LinkMesh only manages the configuration, and it’s priced per managed collector, not per gigabyte, so a large Windows estate doesn’t turn into a volume bill. (Two more things worth doing at fleet scale: mask usernames and account details out of the Security channel before they leave the host, and filter noisy events so you don’t pay to store Information-level chatter.)
Troubleshooting
- Service won’t stay running — the config has a YAML error. Check
services.msc→ the service stops right after starting. Validate the file, or runotelcol-contrib --config config.yamlonce in a console to see the error. - No data in Grafana — re-check the OTLP endpoint and the
Basictoken from Grafana Cloud (Connections → OTLP), and confirm the box can reach the internet on 443. - Security channel is empty — the service must run as
LocalSystem(the MSI default) to read the Security log; a normal user can’t. - Counter not found — performance-counter names are localised. On a non-English Windows, use the local counter names (or the numeric counter IDs).
Windows Server doesn’t have to be the box that’s stuck on a legacy agent. One MSI, one service, your Grafana details — and it’s reporting next to everything else.
LinkMesh manages the Collector on every host from one self-hosted control plane — pick a role, preview the config, and deploy over OpAMP, with PII masking and audited rollout, priced per collector rather than per gigabyte. Stand one up in minutes, or see what it does.