

 LinkMeshObservability Data Collection Management
Windows & Linux Update Monitoring
Patch compliance across the whole fleet, in one Grafana view.
 Roman Hüsler← Back to blog
Ask “which of our servers are missing security updates?” and in most shops the answer takes an afternoon. Windows patch state lives in WSUS or SCCM; Linux lives in apt or yum and a spreadsheet; nobody has a single view, and “days since last patch” per host is a manual audit. It’s a security and compliance gap hiding in plain sight.
You don’t need another patch-reporting product to close it. The OpenTelemetry Collector you (probably) already run for metrics and logs can also collect each host’s update state — pending updates, security patches, reboot-required, last patched — from both Windows and Linux, and ship it to Grafana as one unified, alertable view.
Platform, sysadmin, and security teams running a mixed Windows + Linux fleet who want one cross-OS view of patch compliance — without standing up a separate reporting tool. Prerequisites: an OpenTelemetry Collector on your hosts (or a plan for one) and a Grafana target (Grafana Cloud’s free tier works, or self-hosted Prometheus + Loki).
What “monitoring updates” actually means
Four signals answer nearly every patch-compliance question, and you want them the same way on every host regardless of OS:
- Pending updates — how many updates are available, and how many are security.
- Reboot required — is the host waiting on a restart to finish patching?
- Last patched — when did updates last install? (“Days since” is your compliance clock.)
- Update failures — did the last patch run error out?
The trick is collecting those four consistently from Windows and Linux, then landing them in one backend so a single dashboard and a single alert rule cover the whole fleet. (For the general shape of source → pipeline → destination, see what is a telemetry pipeline?.)
The approach: the Collector is the unifier
Neither Windows nor Linux exposes “updates available” as an OTLP metric out of the box,
so you produce that signal locally and let the Collector pick it up and normalise it.
The most robust, cross-OS way uses the exporters you may already run — the Collector’s
prometheus receiver scrapes them, tags each stream with os.type and host.name,
and exports one OTLP feed to Grafana.
Windows — windows_exporter’s update collector
windows_exporter ships an
update collector that reports the number of pending updates (and how long since
the last search). Enable it and point the OTel Collector at it:
receivers:
  prometheus/windows:
    config:
      scrape_configs:
        - job_name: windows-updates
          scrape_interval: 5m
          static_configs:
            - targets: ["localhost:9182"]   # windows_exporter with --collectors.enabled=...,update
processors:
  resourcedetection:
    detectors: [system]          # host.name, os.type=windows
  batch:
exporters:
  otlphttp/grafana:
    endpoint: "https://otlp-gateway-<zone>.grafana.net/otlp"
    headers: { Authorization: "Basic <base64 instanceID:token>" }
service:
  pipelines:
    metrics:
      receivers: [prometheus/windows]
      processors: [resourcedetection, batch]
      exporters: [otlphttp/grafana]
Linux — node_exporter’s textfile collector
On Linux the canonical pattern is node_exporter’s
textfile collector: a cron job runs a small script that writes update state to a
.prom file, and node_exporter serves it. The well-known apt/yum scripts emit metrics
like apt_upgrades_pending, apt_security_upgrades_pending, and node_reboot_required:
# /etc/cron.hourly/update-metrics  (Debian/Ubuntu example)
OUT=/var/lib/node_exporter/textfile/updates.prom
pending=$(apt-get -s upgrade | grep -c '^Inst')
security=$(apt-get -s upgrade | grep -ci security)
reboot=$([ -f /var/run/reboot-required ] && echo 1 || echo 0)
cat > "$OUT.tmp" <<EOF
updates_pending $pending
updates_security_pending $security
node_reboot_required $reboot
EOF
mv "$OUT.tmp" "$OUT"
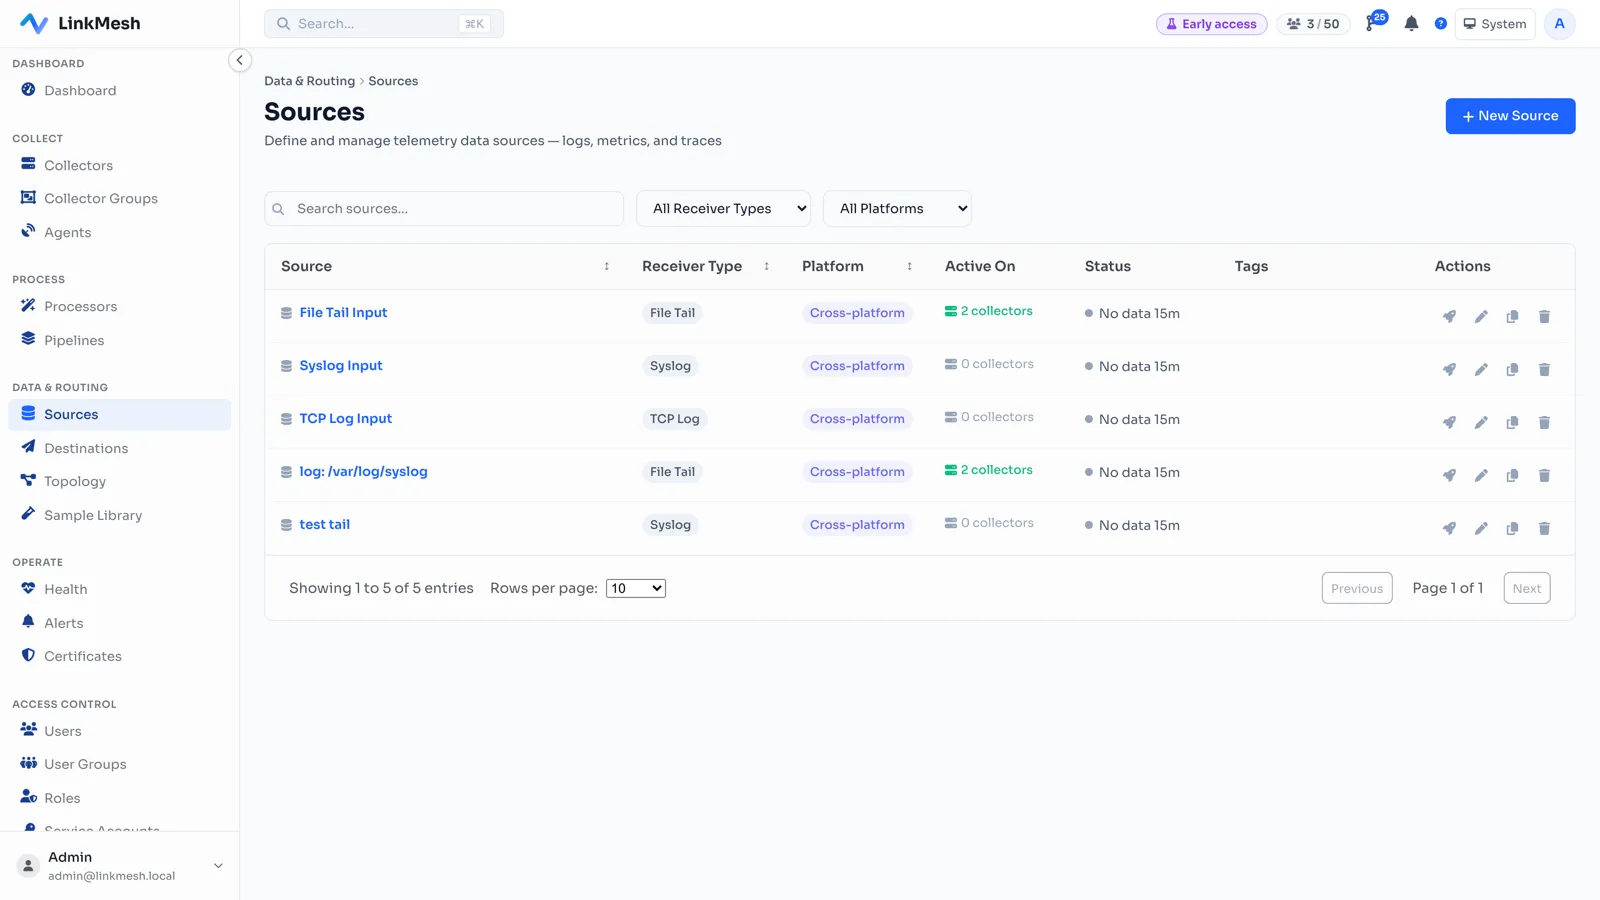
Then the OTel Collector scrapes node_exporter (localhost:9100) exactly like the
Windows job above — same resourcedetection + otlphttp/grafana, just os.type=linux.
If you’d rather not run Prometheus exporters, have the scheduled task (Windows) or cron
job (Linux) write a one-line JSON status file, and read it with the Collector’s
filelog receiver into Loki. You lose the tidy numeric time series but keep a
per-host, cross-OS record you can query and alert on — and it’s zero extra daemons.
One dashboard, one alert, both operating systems
Because every host lands the same four signals in one backend — tagged with host.name
and os.type — the Grafana side is genuinely OS-agnostic:
- A fleet table: hostname, OS, pending updates, security-pending, reboot-required, days-since-last-patch — sortable, so the worst offenders float to the top.
- A compliance stat: percentage of the fleet with zero pending security updates.
- One alert rule that fires when any host has security updates pending for more than N days, or a production host has been waiting on a reboot — Windows and Linux covered by the same expression.
That’s the payoff the scattered-tools approach can’t give you: “which servers are behind, across the whole estate” becomes a saved query, not an afternoon.
Rolling it out across the fleet
The catch at scale is that the config differs by OS — Windows collectors scrape windows_exporter, Linux collectors scrape node_exporter — and hand-editing YAML on every box over RDP or SSH is the toil that stops this from happening.
That’s where a control plane earns its place. The Collector speaks OpAMP, so LinkMesh can push the Windows update-monitoring config to your Windows collectors and the Linux one to your Linux collectors from one place — enroll each host with a token, pick the OS variant, preview, and deploy, with every change versioned and audited. It’s the same fleet-management story as the rest of your telemetry, now covering patch state too. (Pairs naturally with monitoring Windows Server itself in Grafana.)
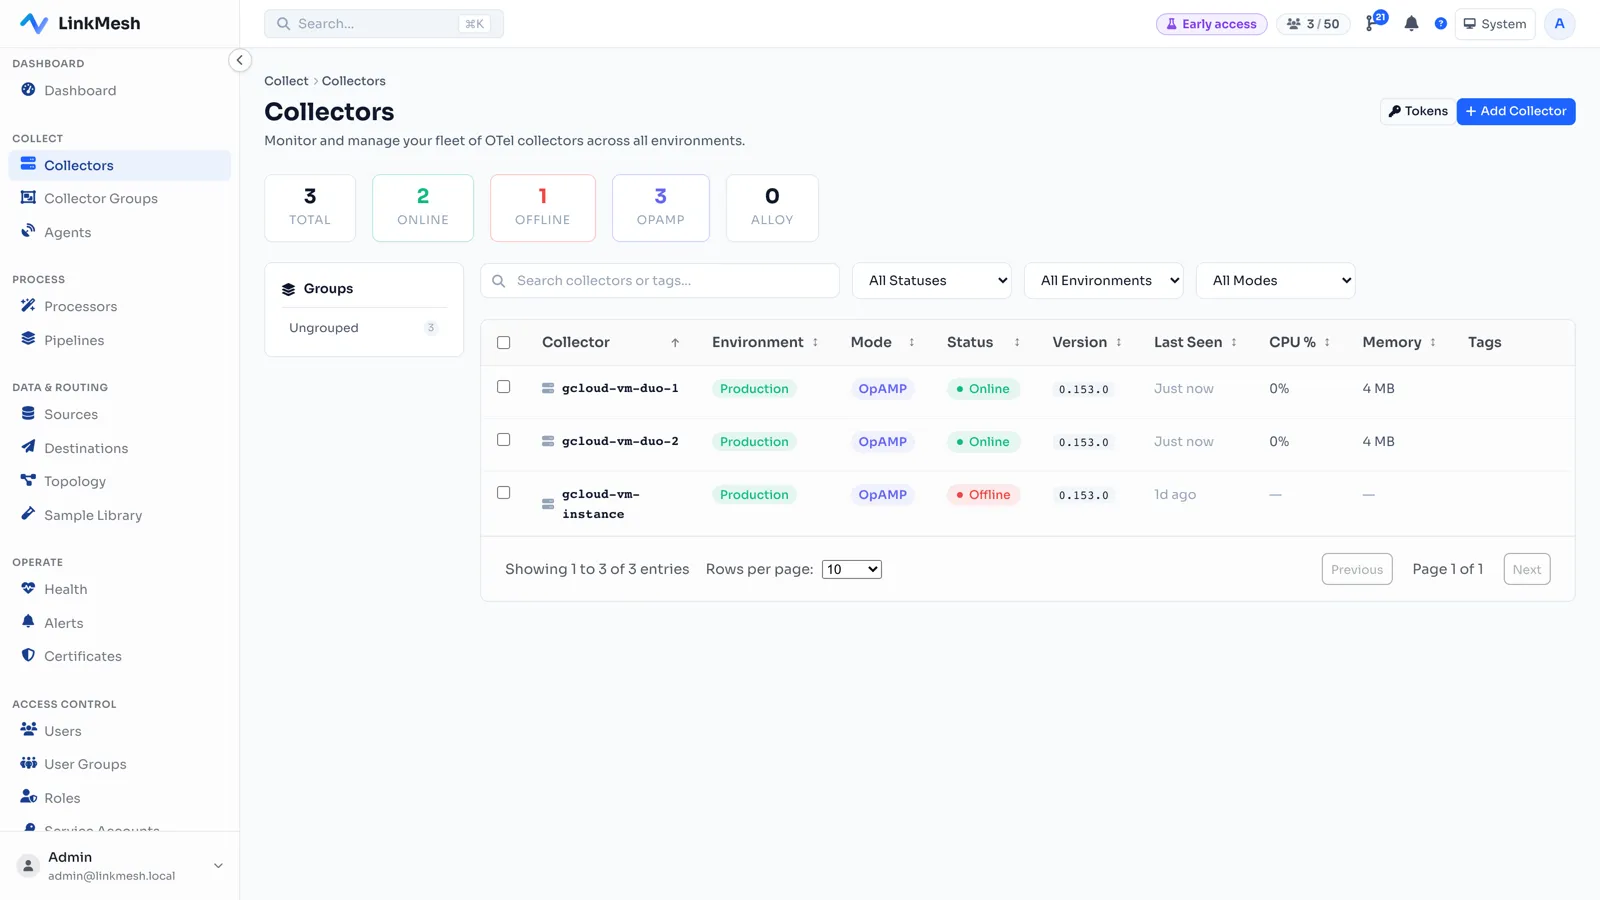
Telemetry flows straight from each host to Grafana and stays on your network; LinkMesh only manages configuration, and it’s priced per managed collector, not per gigabyte — so a big mixed fleet doesn’t become a volume bill.
Where to start
- Pick the signal source — windows_exporter
update+ node_exporter textfile for clean metrics, or a script +filelogif you’d rather not run exporters. - Scrape it from the local Collector and tag with
resourcedetectionsoos.typeandhost.namecome along. - Build the fleet table and one alert in Grafana across both OSes.
- Roll the per-OS config out over OpAMP so every new host reports automatically.
Patch compliance doesn’t need its own silo. The pipeline you already run for observability can carry update state too — and once it does, “are we patched?” is one dashboard, for Windows and Linux alike.
LinkMesh pushes per-OS Collector config to every Windows and Linux host from one self-hosted control plane — enroll, pick the variant, preview, and deploy over OpAMP, priced per collector rather than per gigabyte. Stand one up in minutes, or see what it does.