
 LinkMeshObservability Data Collection Management
Throughput You Can Actually See
Live records-per-second on every edge — measured, not estimated, and not priced per gigabyte.
 Philippe Braxmeier← Back to blog
Here’s a question that’s surprisingly hard to answer about your own observability setup: how much telemetry is flowing through it right now?
For most teams the honest answer is “I’ll know next month, when the bill arrives.” Volume is something you reconstruct after the fact from an invoice or a vendor dashboard that only counts what you’re billed for — bytes ingested, not records moving. By the time you can see it, it’s already happened.
That’s backwards. The place volume actually flows is your pipeline — the collectors, routes, and destinations moving records from your services to your backend. So that’s where the number should be.
Records per second, right on the wire
LinkMesh puts a live throughput reading on the topology canvas. Flip the Throughput toggle and every edge of the graph carries a rate — how many records per second are actually crossing it.
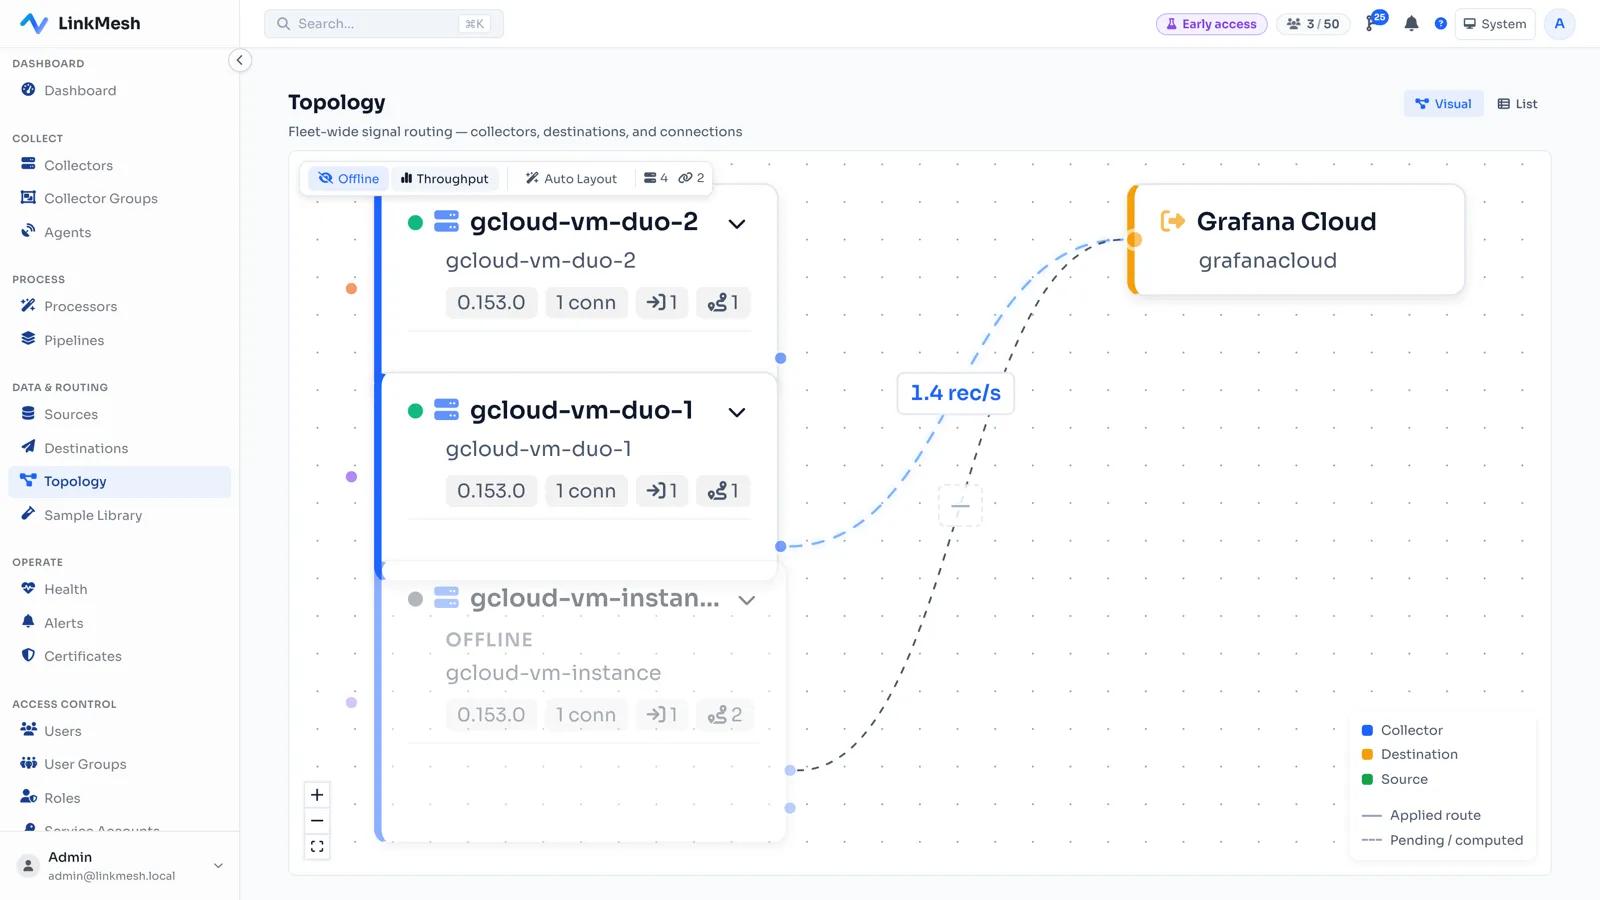
That 1.4 rec/s on the edge to Grafana Cloud isn’t an estimate or a sampled
guess — it’s what that exporter is sending. And it costs you nothing extra to
see it: the number comes from the collector’s own self-telemetry, the
otelcol_* metrics every OpenTelemetry Collector already emits about itself.
LinkMesh just reads them and draws them on the graph. No extra agent, no
instrumentation, no separate metrics pipeline to stand up.
Why records and not bytes by default? Because records are the honest unit. The OpenTelemetry Collector counts items — log records, metric data points, spans — so records-per-second is what it can report accurately without guessing an average event size. It’s also the axis that isn’t trying to sell you anything: LinkMesh isn’t priced per gigabyte, so it has no reason to push a bytes number at you.
The whole fleet at a glance
The canvas is the per-edge view. For the one-number answer — how much is my whole fleet moving? — the dashboard totals it up.
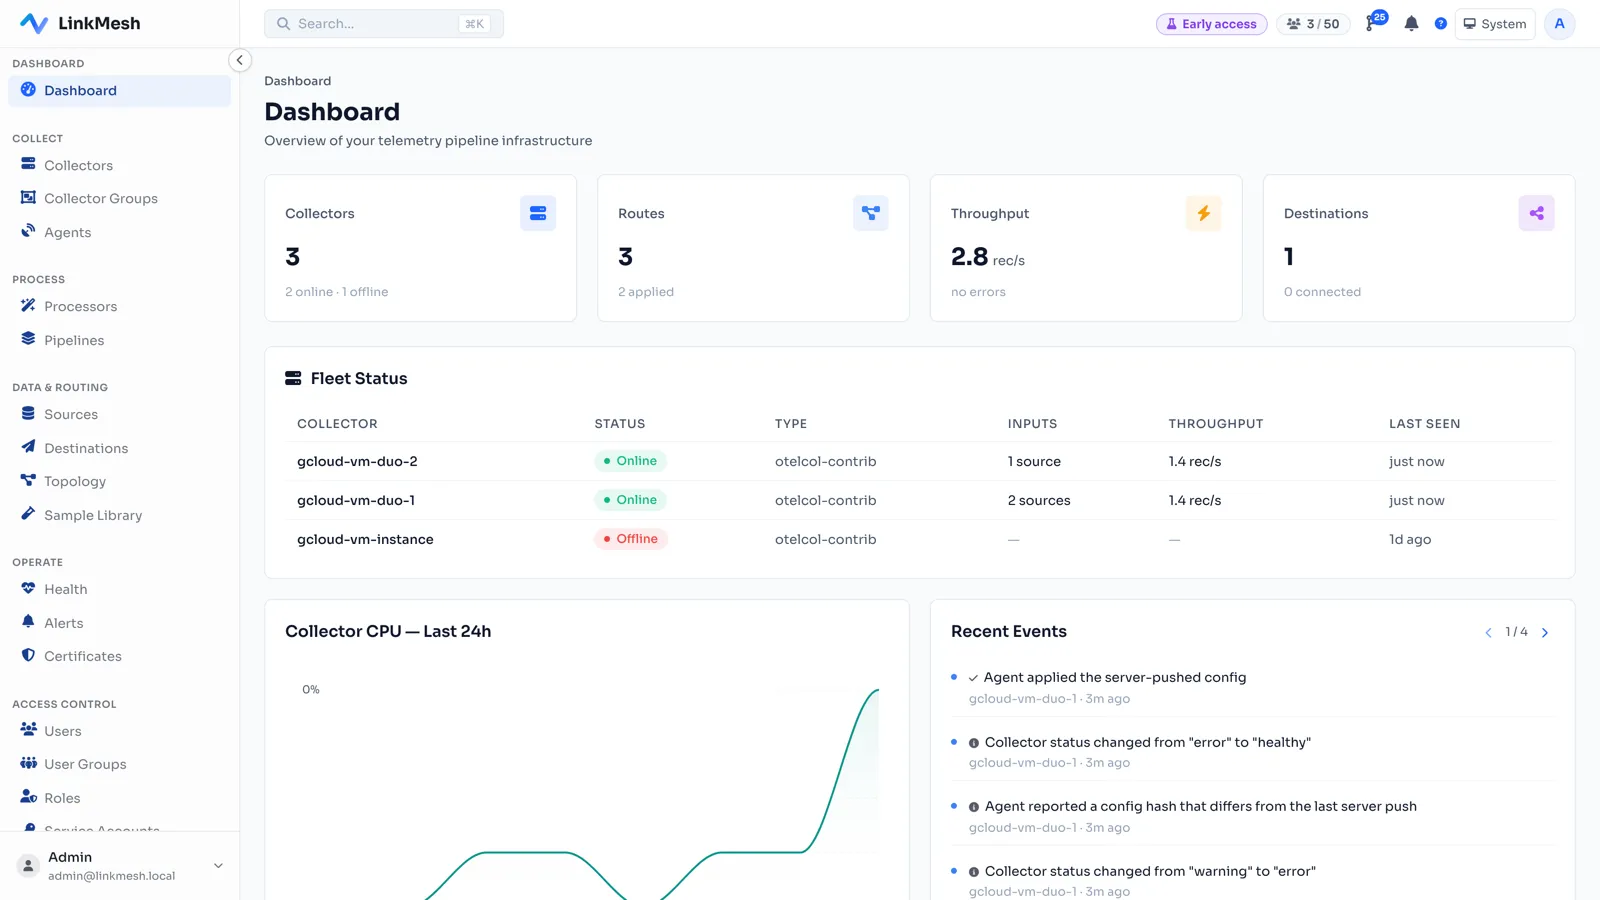
2.8 rec/s, no errors, across three collectors — and the fleet table breaks it down per collector, so a host that’s suddenly doing 10× its neighbours (or one that’s gone quiet) stands out immediately. This is the number you glance at to know your pipeline is alive and roughly where it should be, before you ever open a graph.
One edge, a whole tier
When collectors are grouped into a horizontally-scaled ingest tier, the canvas rolls the whole group up into a single node — and the edge to its destination carries the summed throughput across every member, not one collector’s slice.
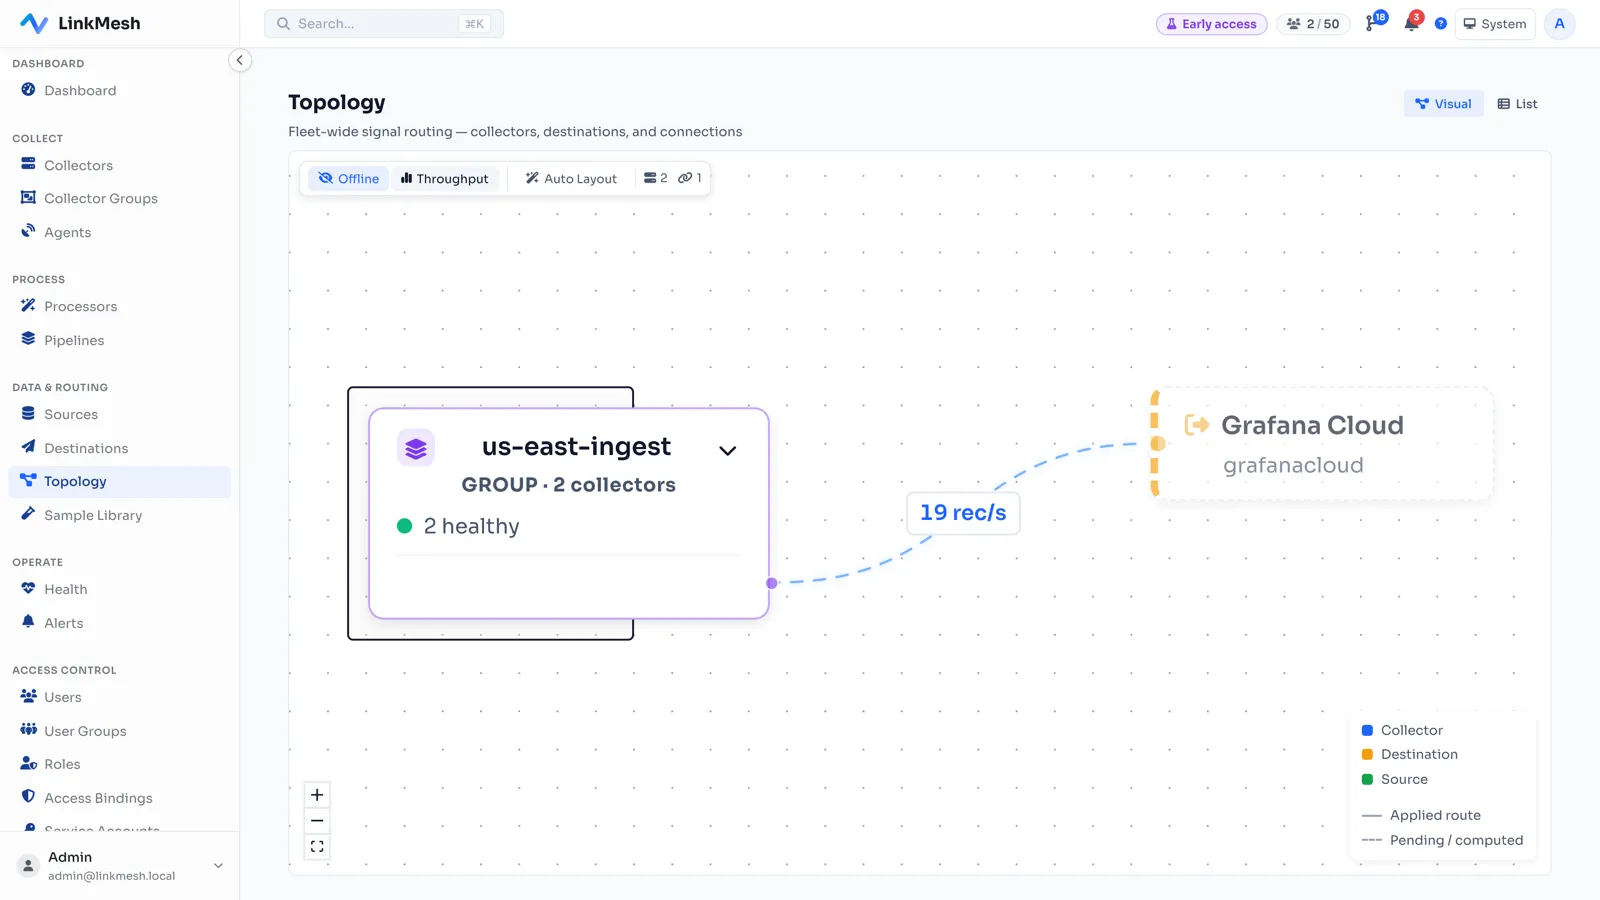
So a five-node ingest tier reads as one number you can trust, and a member that drifts shows up against the group’s own baseline instead of hiding in a fleet-wide average.
Bytes — measured, when you actually need them
Sometimes you do need bytes: you’re accounting for egress, or sizing a downstream contract. LinkMesh gives you bytes too — but measured, not guessed.
Turn on detailed telemetry for a collector and its network-edge overlays — the edges to destinations and to other collectors — gain a measured bytes-per-second, taken from the collector’s transport-size histograms rather than multiplying a record count by an assumed average size. It’s opt-in per collector because detailed telemetry multiplies the collector’s self-metric series, so you enable it exactly where byte-level accounting matters and leave the rest counting records. Bytes only appear where data crosses the wire — node-internal counts stay in records, because that’s where an honest byte number doesn’t exist.
Measured-not-estimated is the whole point. A bytes figure you can’t trace back to a real measurement is just a prettier guess.
Read the pipeline, not just the total
A single throughput number tells you the pipeline is moving. The overlays tell you whether it’s moving the right things:
- Routes show offered vs matched — how many records reached a route and how many it kept. A route meant to keep “only errors” that’s matching 95% of what’s offered is a filter that’s too loose, and you can see it without waiting for the cost of those extra records to show up downstream.
- Destinations show a queue-fill bar and an error flag — the earliest warning that a backend can’t keep up and records are about to be dropped.
- Processor steps show each step’s drop percentage — so a filter quietly shedding far more than you intended is visible at the step, not inferred from a hole in your data.
This is throughput as a diagnostic, not just a gauge. You catch the filter eating too much, or the destination backing up, at the point it happens — instead of reconstructing it later from missing logs and a surprising invoice.
From watching it to being told about it
A number on a canvas still requires someone to be looking at it. The same measured rate can drive a threshold instead, so the pipeline tells you when the volume changes rather than waiting for you to notice.
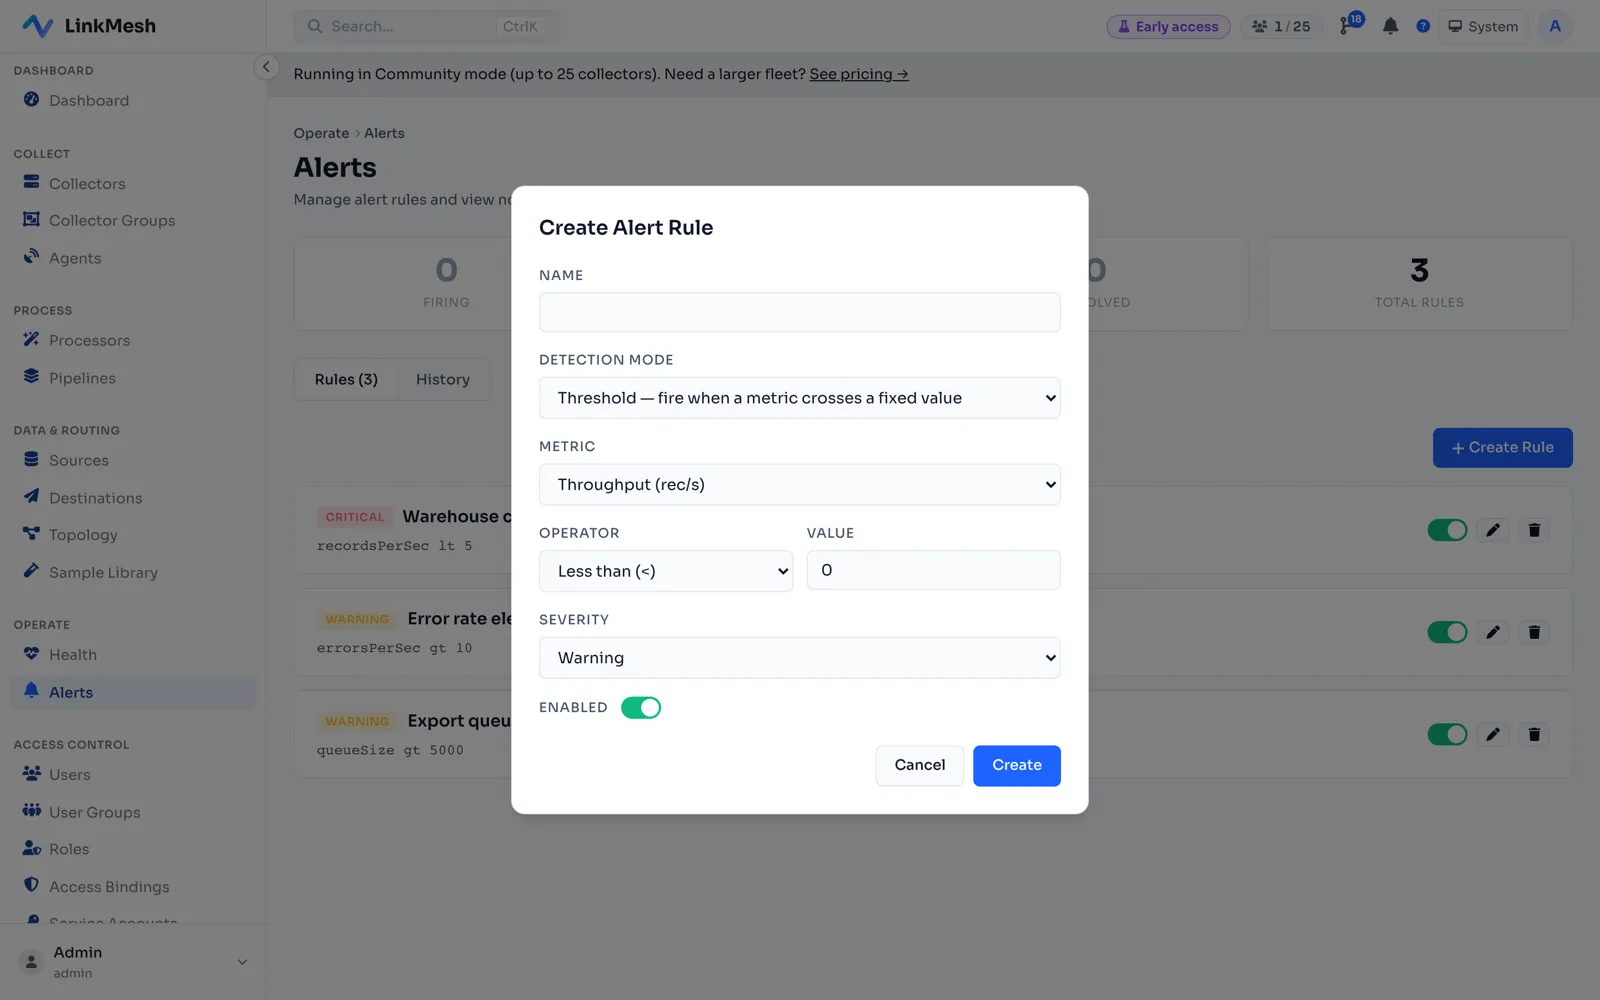
Because it is the same measurement, a rule reads the way you would describe the problem out loud — this collector should be moving more than a trickle, or this route should never exceed what the destination can absorb. And the low-throughput direction matters as much as the high one: a collector that quietly stops receiving data looks identical to a healthy one until someone goes looking for the logs that never arrived.
Throughput you can see is throughput you can trust
Volume shouldn’t be something you learn about after the fact. Put a live, measured, records-first number on every edge of the pipeline and it becomes something you operate by: you know what’s flowing, where, and whether it’s the data you meant to keep — in real time, from metrics the collector was already producing.
Keep reading:
- The full field guide to the overlays: Reading throughput on the canvas
- Cut Your Observability Bill Without Flying Blind
- What Is a Telemetry Pipeline?