LinkMesh

Search docs, blog and changelog

ENDE

Reduce Datadog ingest cost

Reduce Datadog log costs before the data reaches Datadog

Datadog bills indexed log events against a monthly commitment, and custom metrics by how many distinct tag combinations you send — two different meters that reward two different changes. Decide both at the OpenTelemetry Collector, before the datadog exporter runs. Self-hosted, and priced per collector rather than per gigabyte.

Start free →Estimate your savings

25 Collectors free after a no-card registration · 5 without one How the free tier works

You’re paying to ingest data you never use

Datadog’s value is real. The trouble is that its meters do not all measure the same thing, so teams cut volume, watch the invoice hold steady, and conclude the exercise was pointless. Usually they reduced the wrong thing.

You pay to ingest, then again to index

A monthly commitment on indexed log events, with on-demand overage at a documented 50% premium. One noisy deployment can therefore cost more per event than the steady volume around it, and the fix for that is a limit at the edge rather than a cleanup afterwards.

Noise dominates volume

Readiness probes, polling chatter, retry storms, and duplicated fields make up a large share of most log pipelines — ingested, retained, and rarely read.

The agent can’t filter much

A backend’s own agent ships what it’s pointed at. Meaningful reduction means transforming telemetry upstream at the collector, not at Datadog.

PII you can’t un-index

Sensitive fields slip into logs and get indexed in Datadog, where they’re retained and queryable long after they should have been dropped.

One backend for everything

Security-relevant logs and low-value debug output go to the same expensive index, because there’s no layer deciding what belongs where.

No safe way to cut

Nobody drops data in production without a way to see exactly what a filter removes first. So the volume — and the bill — keeps growing.

How Datadog meters, and what actually moves each line

Most reduction projects that end with an unchanged invoice picked the wrong line. Datadog meters several things separately, and only some of them respond to sending less.

Log Management — indexed events

Datadog totals the log events that were INDEXED, against a monthly commitment you set in advance. Go over it and the excess is charged on demand at a premium — Datadog documents that as 50% above the committed rate. A spike therefore costs more per event than the same volume would have cost inside the commitment.

What moves it: Decide at the edge what is worth indexing, and keep the rest out. A rate limit on the collector also protects the commitment from a single noisy deployment, which is the case the premium punishes hardest.
Custom metrics — distinct timeseries

This is the line most teams misread. A custom metric is counted as a unique combination of metric NAME and TAG VALUES, including the host tag, averaged hourly across the month. Datadog states plainly that the count is not affected by how often you submit points.

What moves it: Sending fewer data points changes nothing here. Removing a high-cardinality attribute does: drop one tag carrying a thousand values and you remove a thousand timeseries. This is an attribute-processor change in the collector, not a volume change.

Host-based products

Infrastructure and other per-host products are billed by how many hosts you monitor, not by what those hosts send.

What moves it: Nothing you do to telemetry moves this line. If most of your Datadog spend sits here, filtering is the wrong project and no tool will change that.

Mechanics as Datadog documents them, not as we would like them to be — check them against your own contract, which may differ. Datadog billing documentation Telemetry reaches Datadog through the collector's datadog exporter, so every change below happens before that exporter runs.

Reduce at the source, before Datadog

The work happens in the collector’s processor chain, ahead of the datadog exporter: filter and rate-limit what will be indexed, and strip the high-cardinality attributes that multiply custom-metric timeseries. LinkMesh authors those processors once and rolls them out to a group of collectors. Your telemetry never passes through LinkMesh.

CONTROL PLANE · config, health (never telemetry)LinkMesh — self-hosted control planemanages the drop / filter / sample / mask processors on every collectorconfig · healthSourceshosts · K8sapps · syslogCollector Fleetdrop · filter · sample · maskotelcol-contrib · Grafana Alloymanaged by LinkMeshDatadogonly what you selectCheaper storageobject store · OTLP · or droppedtelemetrykeptrouted
Filtering happens on the collectors; only selected telemetry reaches Datadog. LinkMesh manages the processors and stays out of the data path.

Estimate your savings

Volume is the meter this calculator models, so it speaks to the log side of a Datadog bill and not to custom-metric cardinality or per-host products. Enter your own numbers; every figure is an estimate for planning, and LinkMesh does not set or represent Datadog pricing.

GB / day ingested
per GB

Use your own blended rate — the example is not a Datadog list price.

Enter a reduction measured from a representative sample. Filtering potential depends on your workload and retention requirements.

collectors (first 25 free)

Estimated annual impact

Current Datadog ingest
—
Volume removed
—
Backend savings / year
—
− LinkMesh licence / year
—
Estimated net saving / year
—

Estimates only, for planning. Actual savings depend on your data, contract, and how aggressively you filter. LinkMesh does not set or represent Datadog pricing.

01

Drop the logs Datadog shouldn’t index

Problem

Health checks, readiness probes, and polling noise are ingested and indexed at full price, then almost never queried.

LinkMesh

Write filter rules that read plainly — drop where service.name = "health-check" — and apply them at the Collector, before anything reaches Datadog. LinkMesh renders the rule to OTTL and pushes it across the fleet.

The noise never reaches a billed index. Same signals, a fraction of the volume.

How-to: drop noisy logs →
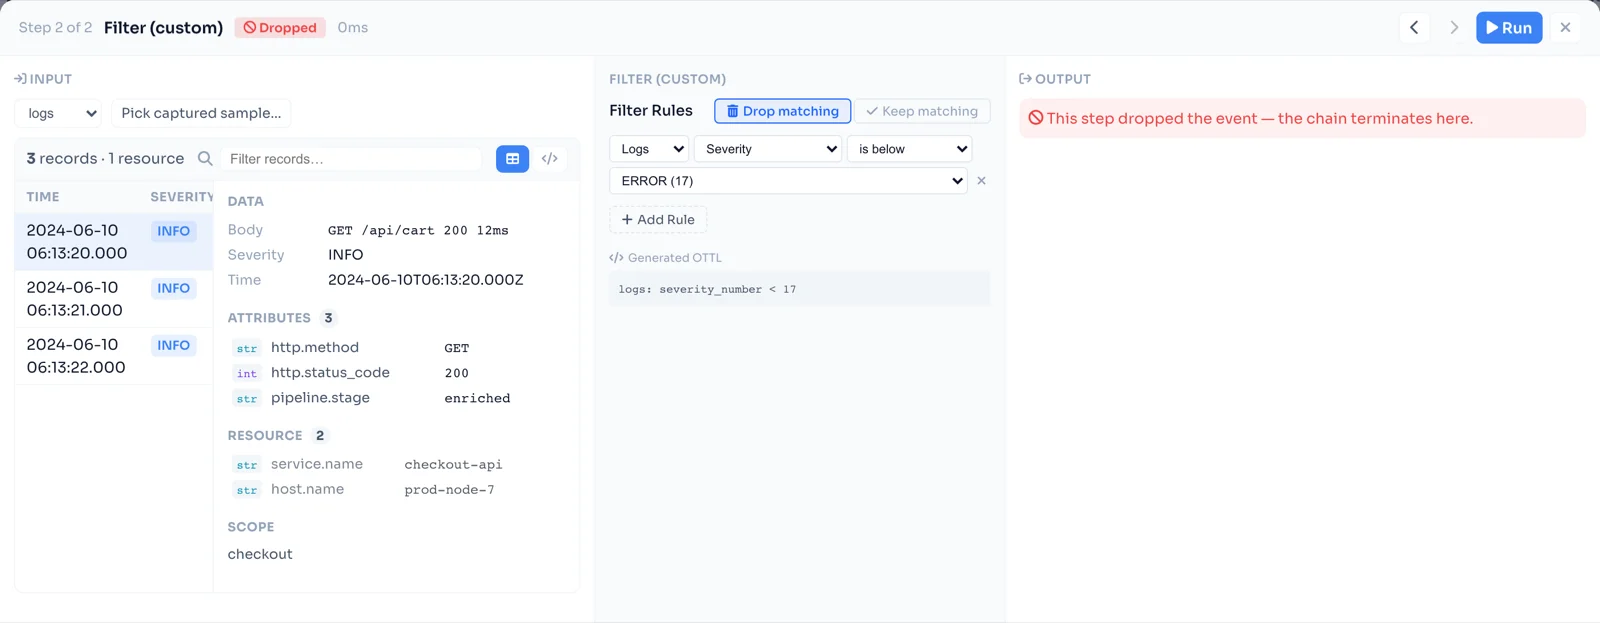
The LinkMesh processor preview — a sample log record entering a drop filter on the left, the rule and generated OTTL in the middle, and the dropped-event output on the right.
Preview a real record through a drop filter — input, rule, and output side by side — before you ship it.

02

Filter and sample before ingest

Problem

Debug output and high-cardinality, high-volume events multiply your ingest without a matching increase in value.

LinkMesh

Keep debug locally or route it to cheap storage; statistically sample repetitive events; trim duplicated and unused attributes that inflate every record. All at the source, as managed processors on the collector.

Send Datadog the events worth indexing — not every retry and every field.

How processors transform telemetry →
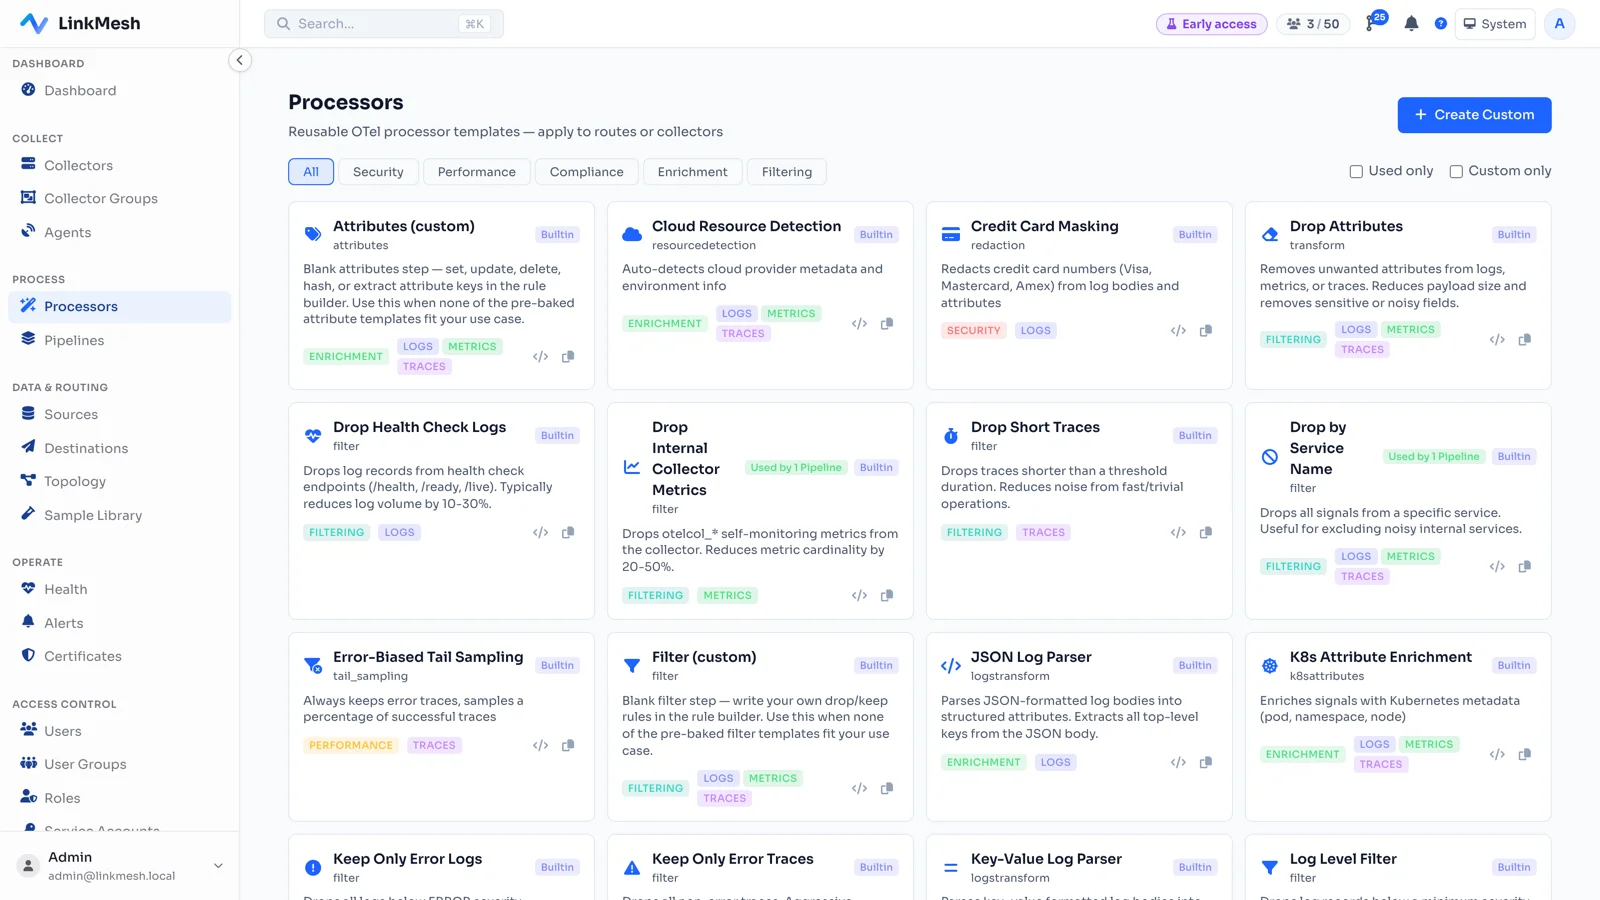
The LinkMesh processor library, with built-in filtering, sampling, and masking templates that attach to a collector or group.
A library of filtering, sampling, and masking processors — attach them to a collector or a whole group.

03

Route selectively — Datadog for what matters

Problem

When one pipeline sends everything to Datadog, low-value telemetry pays the same premium as your security-critical logs.

LinkMesh

Define routes by label, source, or environment: send security-relevant logs to Datadog and fan the rest to object storage, a cheaper backend, or an OTLP destination — from the same collector, with a different processing chain per route.

Datadog keeps the data that belongs there; everything else stops paying Datadog prices.

How routes fan telemetry to backends →
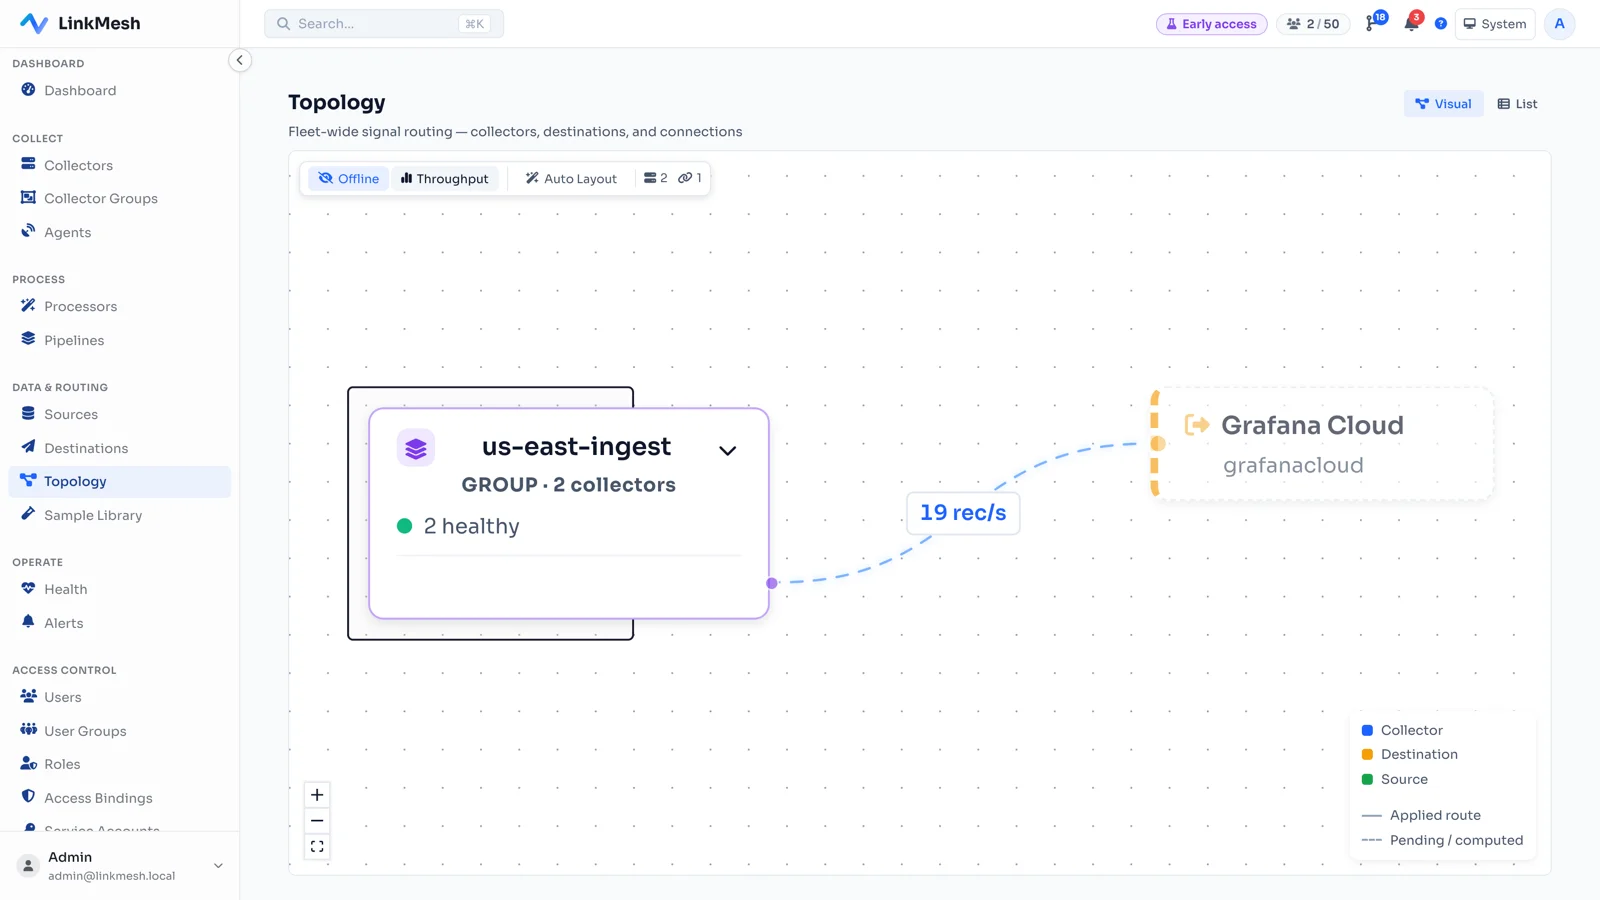
The LinkMesh topology view — a collector group routing telemetry to a destination, with live records-per-second on the connecting edge.
Route by label or environment: Datadog for security logs, cheaper storage for the rest.

04

Redact PII before it’s indexed

Problem

Credit cards, emails, tokens, and IDs slip into logs and get indexed in Datadog, where they’re retained and queryable by people who shouldn’t see them.

LinkMesh

Apply masking processors on the host, before telemetry leaves your network. Built-in templates for common patterns plus custom OTTL rules for your fields — so sensitive values never reach the index.

Sensitive data is gone before egress — not something to scrub from Datadog later.

How-to: mask PII before egress →

05

Preview every filter before you ship it

Problem

Nobody drops data in production on faith. Without a way to see what a rule removes, the safe choice is to ingest everything — and keep paying.

LinkMesh

LinkMesh previews each processor against real captured records: input on one side, the rule and generated OTTL in the middle, the output on the other. You see exactly what a filter keeps and drops before it reaches a single collector.

Cut with confidence, because you saw what the rule does before it ran.

How-to: filter records on a route →

06

Keep Datadog. Keep OpenTelemetry.

Problem

A cost project shouldn’t become a rip-and-replace migration — and coupling every collector directly to Datadog makes any future change a fleet-wide rewrite.

LinkMesh

LinkMesh sits in front of Datadog as a vendor-neutral collection and processing layer built on standard OpenTelemetry Collectors and Grafana Alloy. Datadog stays your backend; LinkMesh manages what reaches it — and the same layer can route elsewhere the day you want to.

Lower the bill now without locking yourself to any one backend later.

How-to: route to another backend →

If nothing changes

Left alone, none of this gets cheaper: the volume grows on its own, the data that already left cannot be recalled, and each agent added is one more to remove later.

Once it is running

  • A per-collector bill that a volume spike does not move.
  • Sensitive fields masked on the host, before anything leaves the network.
  • Every config change a diff you can review and roll back.
  • Backends you can swap, because nothing proprietary sits in the path.

Common questions

How does LinkMesh reduce Datadog ingest cost?

By filtering, dropping, sampling, and routing telemetry at the OpenTelemetry Collector layer — before the data reaches Datadog. Datadog bills by volume, so removing low-value data at the source directly reduces what you pay to ingest, retain, and query.

Does LinkMesh replace Datadog?

No. LinkMesh sits in front of Datadog as a collection and processing layer. Datadog stays your backend; LinkMesh manages the collectors and controls what telemetry reaches it. The same layer can also route telemetry to other backends if you choose.

Will I lose data I actually need?

You decide what is dropped. Every filter is previewed against real records — input, rule, and output side by side — before it reaches a collector, so you see exactly what is kept and removed. You can route lower-value data to cheaper storage instead of dropping it.

Does my telemetry pass through LinkMesh’s cloud?

No. LinkMesh is self-hosted and carries only configuration and health. Filtering runs in your own collectors, and your telemetry flows straight from them to Datadog or your other backends — it never transits LinkMesh.

How much can I save?

Nobody can answer that without seeing your contract, and a number quoted here would be a guess dressed as a benchmark. What is knowable is which line each change moves: keeping events out of an index lowers indexed-event usage, removing a high-cardinality tag lowers custom-metric timeseries, and neither touches per-host products. Model the log side with the calculator on this page using your own figures. LinkMesh does not set or represent Datadog pricing.

How is LinkMesh priced?

By managed collector, never by data volume. The first 25 collectors are free after a no-card registration in the OpenSight Customer Portal (5 without one); beyond that it is a flat USD 12.50 · CHF 12.00 · EUR 12.50 per collector per month, billed annually, and the bill stops growing at 200 collectors. Your savings scale with volume; your LinkMesh cost does not.

Stop paying to ingest what you don’t use

Self-hosted, vendor-neutral, priced per collector. Stand LinkMesh up, preview your filters against real records, and cut ingest with confidence. The first 25 Collectors are free after a no-card registration in the OpenSight Customer Portal (5 without one).

Install the control plane on any Linux VM — Ubuntu / Debian

curl -fsSL https://artifacts.saas.opensight.ch/binaries/linkmesh-server/latest/linkmesh-server_latest_amd64.deb -o linkmesh-server.deb && sudo apt install -y ./linkmesh-server.deb

RHEL / Rocky / AlmaLinux, collector enrollment, and the full walkthrough: Install guide →

Test this in your own environment

Use these maintained guides to move from product evaluation to a working configuration.

Check versions and limitations first